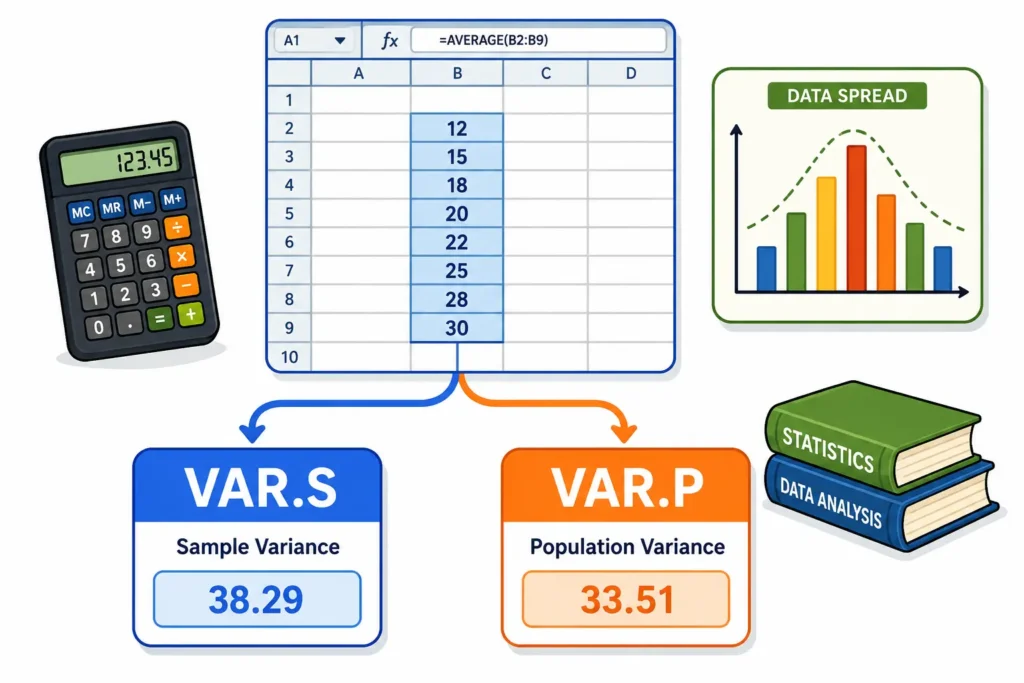
To calculate variance in Excel, type =VAR.S(A2:A9) for a sample or =VAR.P(A2:A9) for a full population, then press Enter. VAR.S divides by n minus 1, VAR.P divides by n. If your numbers are a subset of something bigger, use VAR.S. That one choice is where most people go wrong.
Excel ships six variance functions, and four of them exist only so old spreadsheets keep working. Below is which to use, how to run it, and a worked example you can check by hand so you know the number is right.
Which variance function should you use in Excel?
Start here. Picking the wrong one will not throw an error, it will quietly hand you a number that is too small.
| Function | Use when | Divides by | Status |
|---|---|---|---|
VAR.S | Your data is a sample | n − 1 | Use this |
VAR.P | Your data is the whole population | n | Use this |
VAR | Sample, legacy files | n − 1 | Old name for VAR.S |
VARP | Population, legacy files | n | Old name for VAR.P |
VARA | Sample, counts text as zero | n − 1 | Rarely what you want |
VARPA | Population, counts text as zero | n | Rarely what you want |
The dot versions are the ones Microsoft documents for current Excel releases, and they are what to use in anything you build today. We ran both pairs on the same range to confirm it: VAR.S and VAR return an identical result, as do VAR.P and VARP. The old names are not wrong, they are just older.
How do you calculate sample variance in Excel?
Use VAR.S when your numbers are a slice of a bigger group. Survey responses, a batch of products off a line, thirty customers out of four thousand: all samples.
- Put your numbers in a single column, say A2 to A9.
- Click an empty cell.
- Type
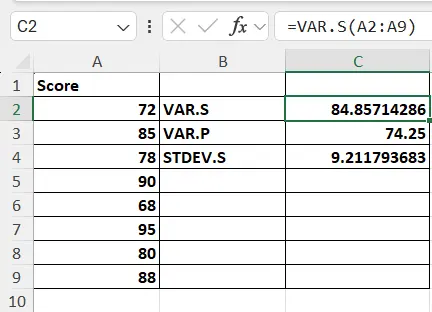
=VAR.S(A2:A9) - Press Enter.
You can also list values directly, as in =VAR.S(72,85,78,90), though referencing a range is easier to audit later. Excel accepts up to 254 arguments, so a range is the practical option for anything real.
How do you calculate population variance in Excel?
Use VAR.P only when your data set is complete. Every student in one classroom, every transaction in one day, every unit in one shipment. If you could not add another data point even if you wanted to, it is a population.
- Put your numbers in a column, A2 to A9.
- Click an empty cell.
- Type
=VAR.P(A2:A9) - Press Enter.
When people are unsure, sample is the safer default. VAR.S gives the slightly larger, more cautious estimate, and treating a population as a sample costs you very little. Treating a sample as a population understates the spread every time.
A worked example you can check by hand
Eight test scores in cells A2 to A9:
72, 85, 78, 90, 68, 95, 80, 88
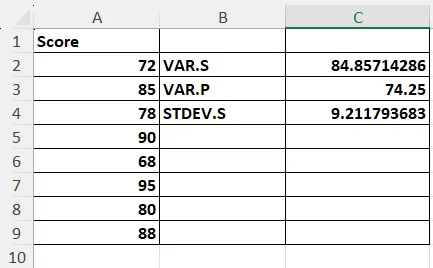
Excel gives =VAR.S(A2:A9) as 84.86 and =VAR.P(A2:A9) as 74.25. Here is where those come from.
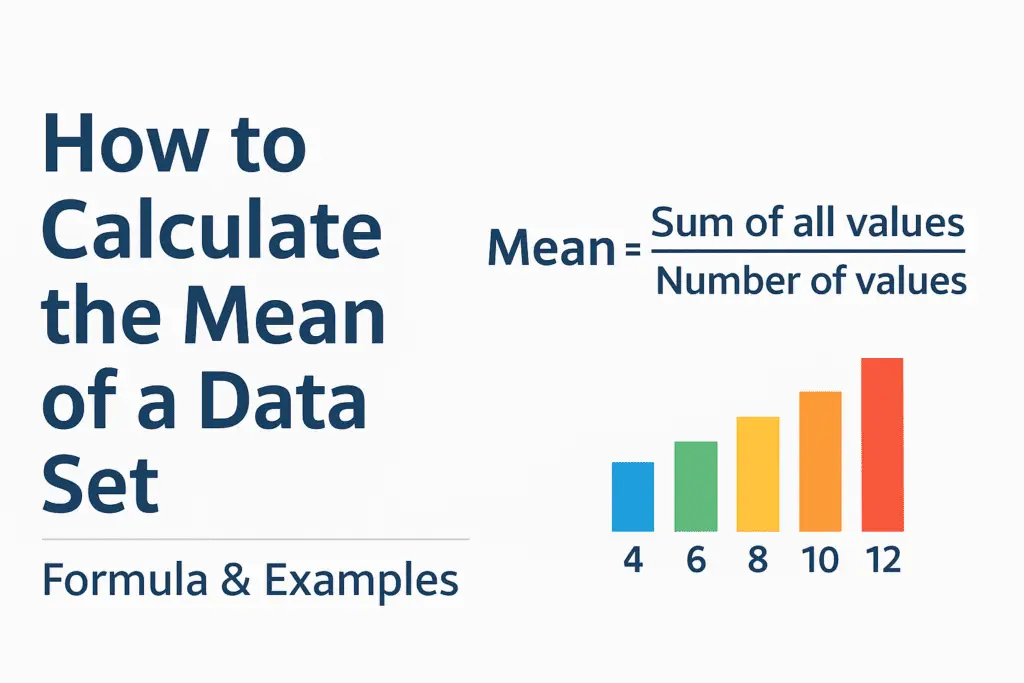
The eight scores add to 656, so the mean is 656 ÷ 8 = 82. Now square the distance of each score from 82:
| Score | Score − 82 | Squared |
|---|---|---|
| 72 | −10 | 100 |
| 85 | 3 | 9 |
| 78 | −4 | 16 |
| 90 | 8 | 64 |
| 68 | −14 | 196 |
| 95 | 13 | 169 |
| 80 | −2 | 4 |
| 88 | 6 | 36 |
Those squares total 594, which is the sum of squares. Divide it by 7 (that is n − 1) and you get 84.86, the sample variance. Divide the same 594 by 8 and you get 74.25, the population variance. Same data, same sum of squares, one different denominator.
If your Excel result matches these two numbers, your range is correct and nothing is being skipped. Unrounded, VAR.S returns 84.857142857142900 and STDEV.S returns 9.211793682944860, so if you widen the decimal places those are the digits you should see. To check a different set without building a sheet, our variance calculator runs the same n and n − 1 split and prints each step.
What is the difference between VAR.S and VAR.P?
One divides by n − 1, the other by n. On the eight scores above that gap is 84.86 against 74.25, which is around 14 percent, and it widens as your sample gets smaller.
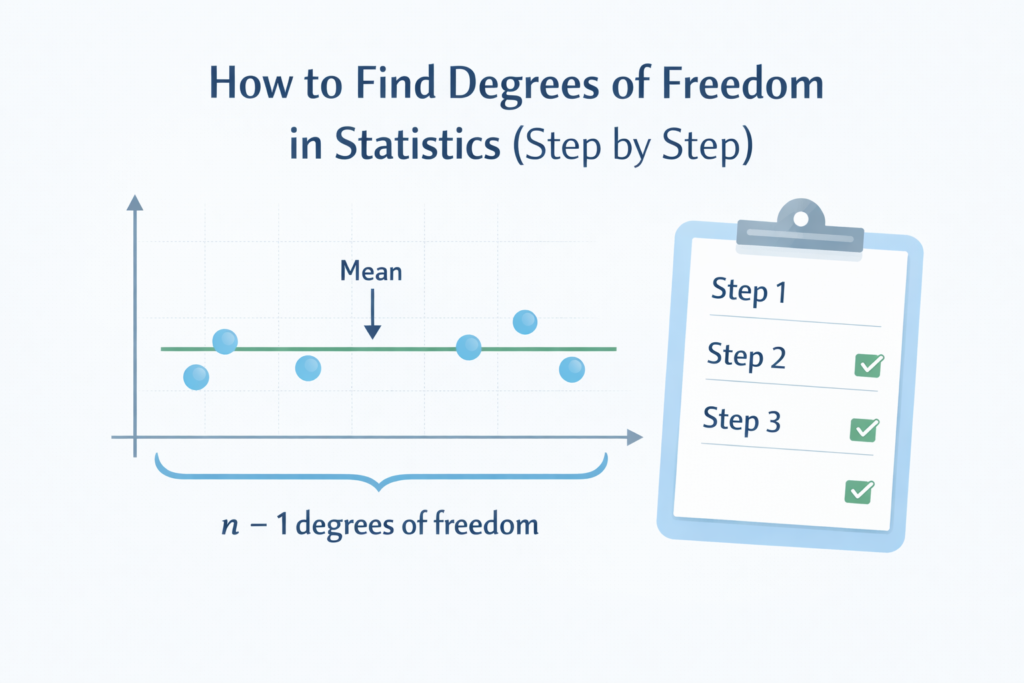
The reason for n − 1 is worth two minutes. When you work from a sample, you do not know the true mean of the population, so you use the sample mean instead. But the sample mean sits, by definition, right in the middle of your own numbers, which makes them look closer together than the full population really is. Dividing by n − 1 instead of n stretches the answer back out to compensate. Statisticians call it Bessel’s correction, and the practical result is simple: on the same data, VAR.S is always larger than VAR.P.
How much does the VAR.S and VAR.P choice actually change your answer?
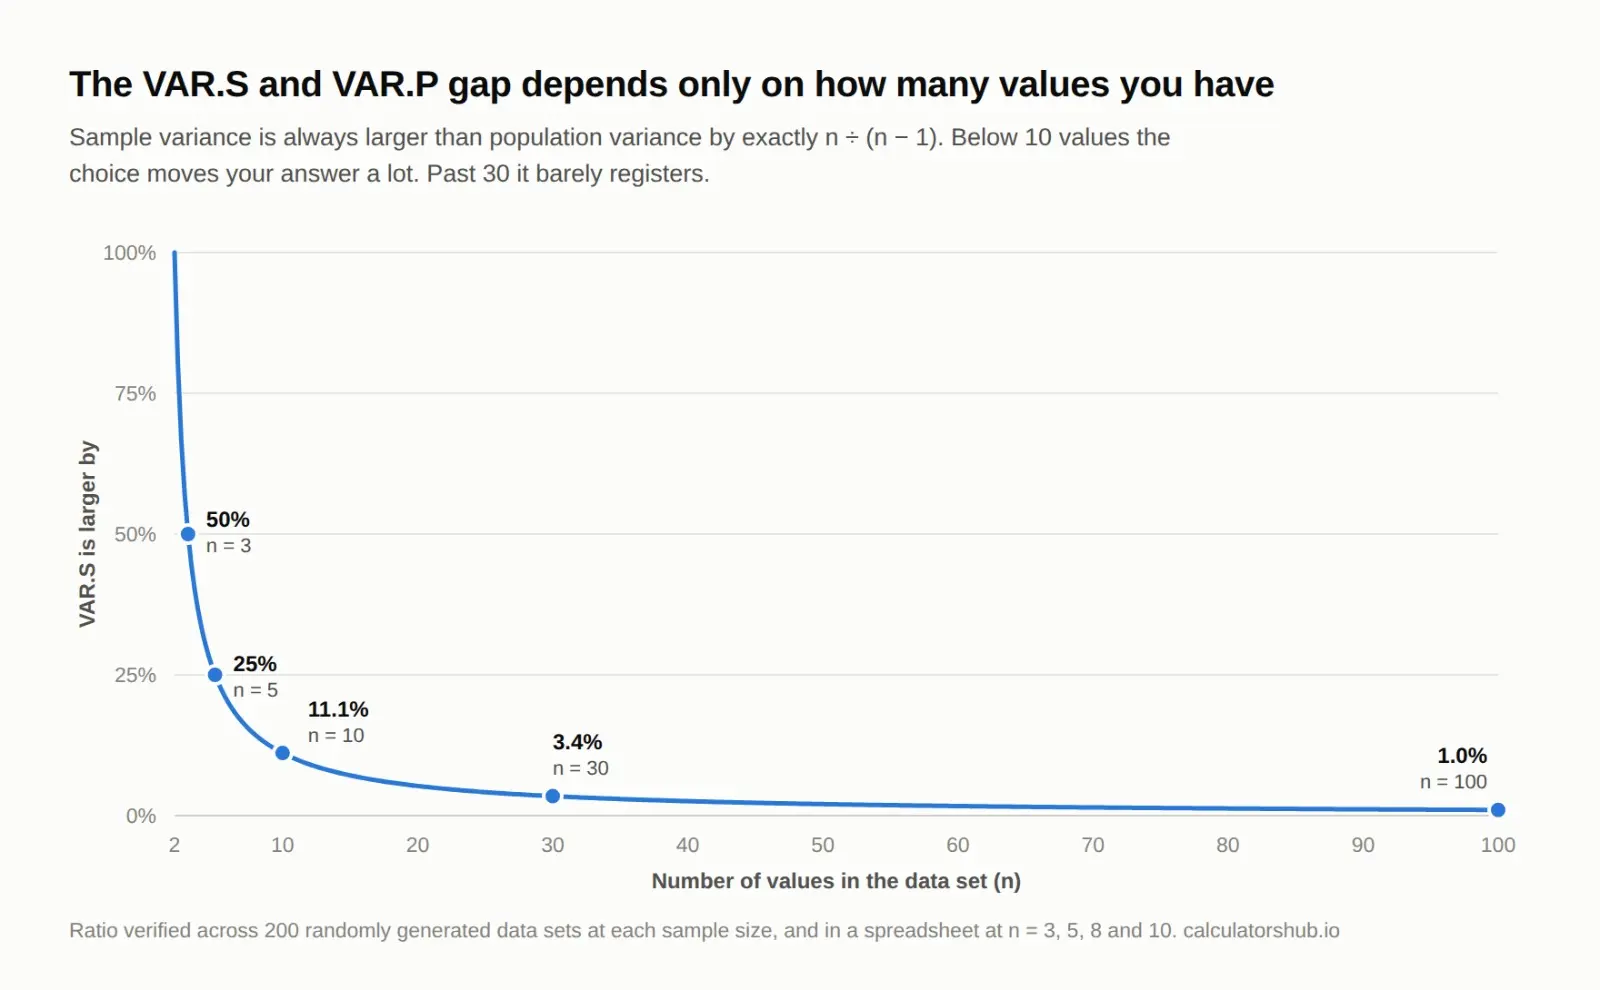
Exactly n ÷ (n − 1), every time. The gap depends only on how many values you have, never on what the values are. We tested this across 200 randomly generated data sets at each sample size and the ratio came out identical to the last decimal place in every one.
| Number of values | VAR.S ÷ VAR.P | VAR.S is larger by |
|---|---|---|
| 3 | 1.5000 | 50.00% |
| 5 | 1.2500 | 25.00% |
| 8 | 1.1429 | 14.29% |
| 10 | 1.1111 | 11.11% |
| 20 | 1.0526 | 5.26% |
| 30 | 1.0345 | 3.45% |
| 50 | 1.0204 | 2.04% |
| 100 | 1.0101 | 1.01% |
| 1000 | 1.0010 | 0.10% |
The practical read: on a class of 30 or a survey of 100, picking the wrong function moves your answer by 3 percent or 1 percent, which rarely changes a decision. On a pilot study with five data points it moves the answer by a quarter. The smaller your data set, the more the choice matters, which is the opposite of what most people assume.
How do you calculate variance percentage in Excel?
This is a different calculation, and the overlap in wording catches people out constantly.
Statistical variance measures spread inside one data set. Variance percentage, the kind used in budgets and forecasts, measures the gap between two numbers. If you budgeted $5,000 and spent $5,600, the formula is =(B2-A2)/A2 formatted as a percentage, which gives 12 percent over budget.
Neither VAR.S nor VAR.P will give you that. If you came here for budget variance, the percentage formula above is what you want, and none of the variance functions apply.
How do you get standard deviation from variance in Excel?
Take the square root. Variance comes out in squared units, which is why 84.86 for a set of test scores is hard to picture. Standard deviation converts it back to the original scale.
Both of these return the same answer:
=SQRT(VAR.S(A2:A9))=STDEV.S(A2:A9)
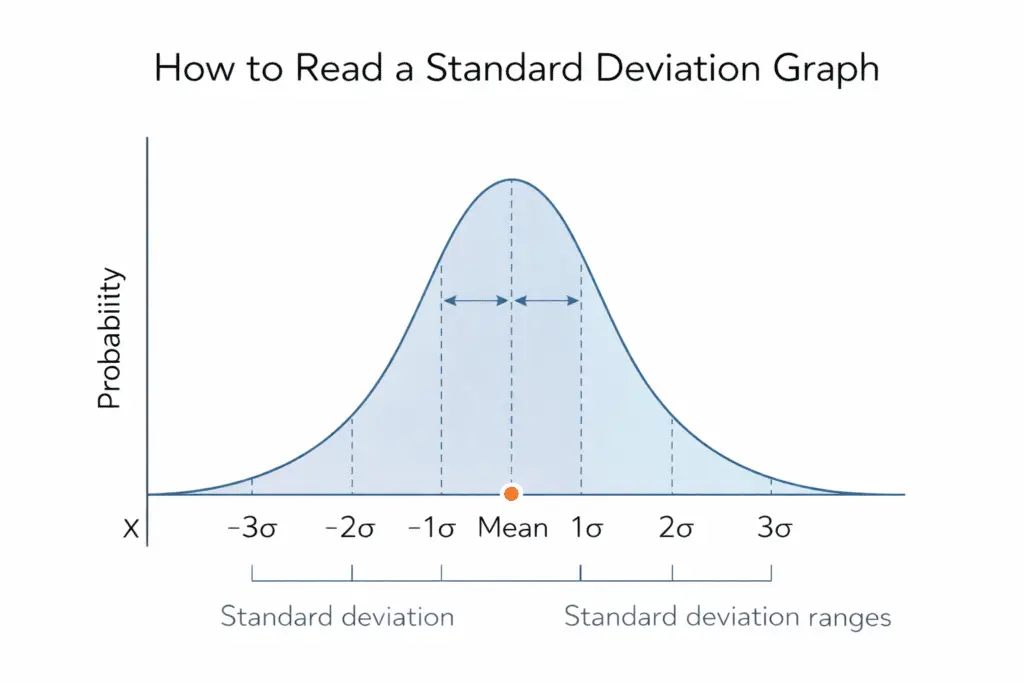
On our eight scores that is 9.21. The population version, =STDEV.P(A2:A9), gives 8.62. A standard deviation of 9.21 on a mean of 82 means a typical score sits about 9 points away from 82 in either direction. That is a sentence you can put in a report, which 84.86 is not. Our standard deviation calculator shows the same steps if you want to check a set without opening Excel.
Why does Excel return #DIV/0! for variance?
Because VAR.S found fewer than two numbers in your range. With only one value there is nothing to divide by, since n − 1 comes out as zero.
The trap is that the range often looks full. Microsoft’s documentation for the VAR.S function states that when an argument is a range, empty cells, logical values, text and error values inside it are all ignored. So a column of forty entries that arrived as text from a CSV import counts as zero numbers to Excel, and the function has nothing left to work with. So a column of forty entries that arrived as text from a CSV import counts as zero numbers to Excel.
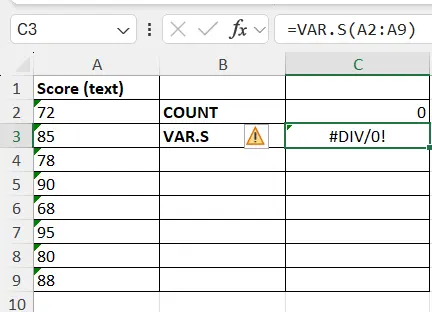
Three things to check, in this order:
- Are the cells left-aligned by default? That usually means Excel is reading them as text, not numbers.
- Does your range accidentally cover only one numeric cell?
- Are there stray spaces or non-breaking characters in the values? Run the column through
=VALUE()or use Text to Columns to convert.
One warning that matters more than the error itself. VAR.P in the same situation does not fail. Given a single numeric value it returns 0, with no error and no flag. We confirmed this on a range holding one number: VAR.S returned #DIV/0! and VAR.P returned zero. A zero variance reads as “these numbers do not vary at all”, which is a sentence people put in reports without checking. If you are using VAR.P and see a suspiciously clean zero, count your numeric cells before you trust it.
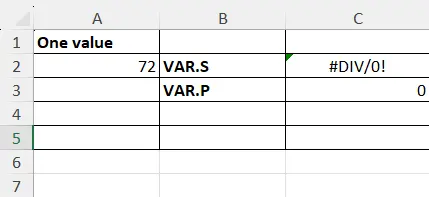
If you genuinely want text and logical values counted as zeros rather than skipped, VARA does that. It is almost never the right call, because a blank in a survey is missing data, not a score of zero.
Does this work in Google Sheets?
Yes, with the same names and the same syntax. VAR.S, VAR.P, VAR and VARP all behave the same way in Google Sheets, and =VAR.S(A2:A9) on the eight scores above returns 84.86 there too.
Frequently asked questions
Is VAR.S or VAR.P better?
Neither is better, they answer different questions. VAR.S estimates the spread of a larger group from a sample of it. VAR.P describes the spread of a group you have measured completely. If you are not certain which you have, use VAR.S.
Can I calculate variance in Excel without a formula?
You can build it manually with a helper column: subtract the mean from each value, square the result with =(A2-$B$1)^2, sum that column, then divide by n − 1. It gives the same answer and is useful for showing your working in a submitted assignment, but VAR.S does it in one step.
Why is my variance so much bigger than my numbers?
Because variance is in squared units. Test scores measured in points produce a variance in points squared. That is normal and it is exactly why standard deviation exists. Take the square root and the number will look sensible again.
Does VAR.S ignore blank cells?
Yes. Blank cells, text and logical values inside a referenced range are skipped rather than treated as zero, according to Microsoft’s published function reference. This is usually what you want, since a blank means no data rather than a value of zero.
What is the keyboard shortcut for variance in Excel?
There is no dedicated shortcut. The quickest route is typing =VAR.S(, dragging over your range, and pressing Enter. Excel autocompletes the function name after the first four characters.
How many values do I need to calculate variance?
Two at minimum for VAR.S, one for VAR.P. Statistically, though, a variance from three or four points tells you very little. Small samples produce unstable estimates, which is why sample size matters more than most people expect.
Why did VAR.P give me zero?
Almost always because your range contains only one numeric value. VAR.S throws #DIV/0! in that situation, but VAR.P returns 0 without complaint. Check the count with =COUNT(A2:A9) before reading anything into a zero variance.
Try these next
- Mean, Median, Mode and Range Calculator
- Coefficient of Variation Calculator for comparing spread across different scales
- Standard Error Calculator for turning variance into a margin of error