Understanding how to find critical value is one of the most important skills in statistics. In a Z-test, T-test, Chi-square test or ANOVA, the critical value is the number you compare your test statistic against. In simple terms, it marks the cutoff point that separates statistically significant results from non-significant ones.
In hypothesis testing, the critical value depends on three main things:
- The significance level (α), such as 0.05 or 0.01
- The type of test (right-tailed, left-tailed, or two-tailed)
- The test distribution (Z, T, Chi-square, or F)
The usual sticking point is knowing which table or distribution the test calls for. That’s why this guide breaks everything down into easy steps, formulas, tables, and worked examples.
Table of Contents
What Is a Critical Value in Statistics?
A critical value is a specific number that separates the rejection region from the non-rejection region in hypothesis testing. It acts as a cutoff point that helps you decide whether your test statistic is extreme enough to reject the null hypothesis.
In simple terms:
If your test statistic is beyond the critical value, you reject the null hypothesis.
If it is not beyond the critical value, you fail to reject it.
Why Is the Critical Value Important?
In statistics, we don’t rely on guesswork. Instead, we compare calculated results to a predefined boundary. That boundary is the critical value.
It helps you:
- Determine statistical significance
- Make objective decisions
- Control the probability of making a Type I error
- Define the rejection region
Without the critical value, hypothesis testing would not have a clear decision rule.
What Determines a Critical Value?
A critical value depends on three main factors:
Significance Level (α)
Common values: 0.10, 0.05, 0.01
Type of Test
- Right-tailed
- Left-tailed
- Two-tailed
Statistical Distribution Used
- Z distribution
- T distribution
- Chi-square distribution
- F distribution
Each distribution has its own critical value formula and table.
Example (Simple Understanding)
Suppose you are conducting a two-tailed Z-test with a significance level of 0.05.
The z critical value is ±1.96.
If your calculated Z score is:
- 2.10 → Reject the null hypothesis
- 1.20 → Fail to reject the null hypothesis
The value ±1.96 acts as the decision boundary.
Critical Value vs Test Statistic
- Critical value → The cutoff point from tables or calculator
- Test statistic → The value you calculate from your sample data
You compare the test statistic to the critical value to make your final decision.
Critical Value Formula (Z, T, Chi-Square, and F)

The critical value formula depends on the statistical test you are performing. Each distribution (Z, T, Chi-square, and F) has its own method for determining the critical value.
Below are the formulas and explanations for each case.
1. Z Critical Value Formula
The Z critical value is used when:
- The population standard deviation is known
- The sample size is large (n ≥ 30)
- The data follows a normal distribution
There is no complex algebraic formula to manually compute a Z critical value. Instead, it is determined using:
- The standard normal distribution table (Z table), or
- A critical value calculator
For a two-tailed test:
Z critical value = Z(α/2)
For a right-tailed test:
Z critical value = Z(α)
Example:
If α = 0.05 in a two-tailed test:
α/2 = 0.025
The Z critical value is ±1.96.
You acn also find this value using a z table or a calculator.
2. T Critical Value Formula
The T critical value is used when:
- The population standard deviation is unknown
- The sample size is small (n < 30)
The formula depends on:
- Significance level (α)
- Degrees of freedom (df)
Degrees of freedom formula:
df = n − 1
T critical value = t(α, df)
You find this value using a T distribution table or a calculator.
Example:
If α = 0.05 and n = 15:
df = 14
The T critical value is found from the t-table at df = 14.
3. Chi-Square Critical Value Formula
The Chi-square critical value is used for:
- Tests of independence
- Goodness-of-fit tests
It depends on:
- Significance level (α)
- Degrees of freedom
Degrees of freedom formulas:
For goodness-of-fit:
df = k − 1
For contingency tables:
df = (rows − 1)(columns − 1)
Chi-square critical value = χ²(α, df)
This value is always taken from the right tail of the Chi-square distribution.
4. F Critical Value Formula
The F critical value is used in:
- ANOVA
- Comparing two variances
It depends on:
- Significance level (α)
- Numerator degrees of freedom (df₁)
- Denominator degrees of freedom (df₂)
F critical value = F(α, df₁, df₂)
You find this value using an F distribution table or calculator.
How to Find Critical Value (Step-by-Step)

Finding a critical value becomes easy when you follow a clear process. The steps are almost the same for Z, T, Chi-square, and F tests. You only change the distribution and the table you use.
Below is a simple step-by-step method used in statistics.
Step 1: Define the Null and Alternative Hypothesis
Start by writing the hypotheses.
- Null hypothesis (H₀): The assumption that there is no effect or difference.
- Alternative hypothesis (H₁): The claim you want to test.
Example:
H₀: μ = 50
H₁: μ ≠ 50
This step also helps determine whether the test is one-tailed or two-tailed.
Step 2: Choose the Significance Level (α)
The significance level represents the probability of rejecting a true null hypothesis.
Common values include:
| Significance Level | Meaning |
|---|---|
| 0.10 | 10% risk of Type I error |
| 0.05 | Most commonly used level |
| 0.01 | Very strict testing level |
The chosen α directly affects the critical value.
Step 3: Determine the Type of Test
Next, identify whether the hypothesis test is:
| Test Type | Description |
|---|---|
| Left-tailed test | Rejection region is on the left side of the distribution |
| Right-tailed test | Rejection region is on the right side |
| Two-tailed test | Rejection regions exist on both sides |
For two-tailed tests, the significance level is divided by two.
Example:
If α = 0.05 → each tail = 0.025.
Step 4: Identify the Correct Distribution
The distribution you use depends on the type of statistical test.
| Test Situation | Distribution Used |
|---|---|
| Known population standard deviation | Z distribution |
| Small sample with unknown standard deviation | T distribution |
| Categorical data testing | Chi-square distribution |
| Comparing variances or ANOVA | F distribution |
Choosing the correct distribution ensures the correct critical value.
Step 5: Find the Critical Value from a Table or Calculator
Finally, use a distribution table or calculator to find the critical value.
You will need:
- Significance level (α)
- Degrees of freedom (if required)
- Test type (one-tailed or two-tailed)
Example:
If α = 0.05 and the test is two-tailed using the Z distribution:
Critical value = ±1.96
Once you find the critical value, compare it with the test statistic to decide whether to reject the null hypothesis.
Z Critical Value (With Example)
The Z critical value is used in hypothesis testing when the data follows a normal distribution and the population standard deviation is known. It is commonly used for large sample sizes, usually when n ≥ 30.
A Z critical value represents the cutoff point on the standard normal distribution. If the calculated Z test statistic goes beyond this value, the null hypothesis is rejected.
When to Use a Z Critical Value
You should use a Z critical value when:
- The population standard deviation (σ) is known
- The sample size is large
- The data is approximately normally distributed
Common Z Critical Values
The most frequently used significance levels have well-known Z critical values.
| Significance Level (α) | Test Type | Z Critical Value |
|---|---|---|
| 0.10 | Two-tailed | ±1.645 |
| 0.05 | Two-tailed | ±1.96 |
| 0.01 | Two-tailed | ±2.576 |
| 0.05 | One-tailed | 1.645 |
These values come from the standard normal distribution table.
Example: Finding a Z Critical Value
Suppose you are conducting a hypothesis test with the following information:
- Significance level (α) = 0.05
- Two-tailed test
- Normal distribution
Step 1: Divide α by 2 because it is a two-tailed test.
α / 2 = 0.05 / 2 = 0.025
Step 2: Look up 0.025 in the Z table.
Step 3: The corresponding Z critical value is:
Z = ±1.96
This means the rejection regions are:
- Z < −1.96
- Z > 1.96
If the calculated Z test statistic falls outside this range, the null hypothesis is rejected.
Visual Understanding
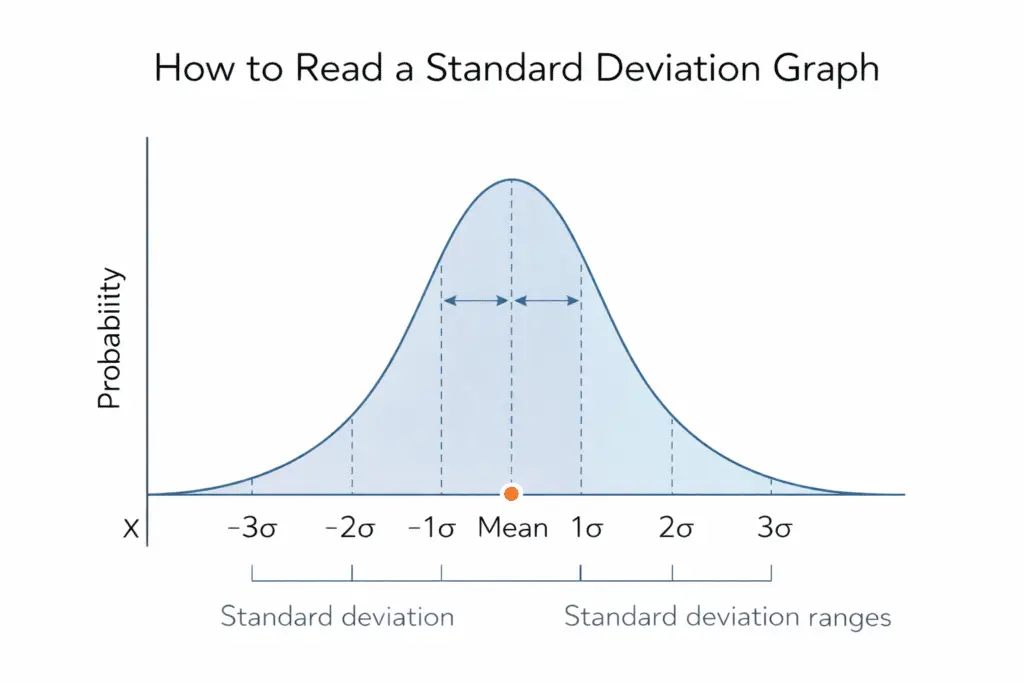
On a normal distribution curve, the values −1.96 and +1.96 mark the boundaries of the rejection region for a two-tailed test at the 0.05 significance level. The normal distribution calculator confirms it: the area outside those two z values comes to 0.049996.
T Critical Value (With Example)
The T critical value is used in hypothesis testing when the population standard deviation is unknown and the sample size is small. It comes from the t-distribution, which is similar to the normal distribution but has heavier tails.
Because of this, the T critical value changes depending on the degrees of freedom.
When to Use a T Critical Value
Use a T critical value when:
- The population standard deviation (σ) is unknown
- The sample size is small (n < 30)
- The data is approximately normally distributed
Degrees of Freedom
To find the T critical value, you first calculate the degrees of freedom (df).
Formula:
df = n − 1
Where:
- n = sample size
Example:
If the sample size is 20:
df = 20 − 1 = 19
Common T Critical Values
Below are common values for a two-tailed test with α = 0.05.
| Degrees of Freedom | T Critical Value |
|---|---|
| 5 | ±2.571 |
| 10 | ±2.228 |
| 15 | ±2.131 |
| 20 | ±2.086 |
| 30 | ±2.042 |
As the sample size increases, the T distribution slowly approaches the Z distribution.
Example: Finding a T Critical Value
Suppose you are performing a hypothesis test with the following information:
- Sample size (n) = 16
- Significance level (α) = 0.05
- Two-tailed test
Step 1: Calculate the degrees of freedom.
df = 16 − 1 = 15
Step 2: Divide α by 2 because it is a two-tailed test.
α / 2 = 0.025
Step 3: Look up the value in the t-distribution table for df = 15 and α = 0.025.
The T critical value is ±2.131.
Interpretation
This means the rejection regions are:
- t < −2.131
- t > 2.131
If your calculated t test statistic falls outside this range, you reject the null hypothesis.
Chi-Square Critical Value (With Example)
The Chi-square critical value is used in statistical tests that involve categorical data. It comes from the Chi-square distribution and helps determine whether the difference between observed and expected values is statistically significant.
This critical value is commonly used in:
- Chi-square test of independence
- Chi-square goodness-of-fit test
Unlike the Z or T distribution, the Chi-square distribution is not symmetrical and values are always positive.
When to Use a Chi-Square Critical Value
Use a Chi-square critical value when:
- You are analyzing categorical data
- You want to test relationships between variables
- You are comparing observed frequencies with expected frequencies
Degrees of Freedom
To find the Chi-square critical value, you must first calculate the degrees of freedom (df).
For a goodness-of-fit test:
df = k − 1
Where:
k = number of categories
For a contingency table:
df = (rows − 1) × (columns − 1)
Example: Finding a Chi-Square Critical Value
Suppose you are performing a Chi-square test with the following information:
- Significance level (α) = 0.05
- Number of categories = 5
Step 1: Calculate the degrees of freedom.
df = 5 − 1 = 4
Step 2: Use a Chi-square table with α = 0.05 and df = 4.
Step 3: The Chi-square critical value is:
χ² = 9.488
Interpretation
The rejection rule becomes:
Reject the null hypothesis if:
χ² calculated > 9.488
If the calculated Chi-square statistic is smaller than the critical value, the null hypothesis cannot be rejected.
Example Table of Common Chi-Square Critical Values
| Degrees of Freedom | α = 0.05 |
|---|---|
| 1 | 3.841 |
| 2 | 5.991 |
| 3 | 7.815 |
| 4 | 9.488 |
| 5 | 11.070 |
These values are taken from the Chi-square distribution table.
F Critical Value (With Example)
The F critical value is used in statistical tests that compare variances between two or more groups. It comes from the F-distribution and is commonly used in ANOVA (Analysis of Variance) and variance ratio tests.
The F distribution is different from Z and T distributions because it depends on two sets of degrees of freedom.
When to Use an F Critical Value
Use an F critical value when:
- Comparing variances of two populations
- Performing ANOVA tests
- Analyzing variation among multiple groups
The F value helps determine whether the variability between groups is larger than the variability within groups.
Degrees of Freedom for F Distribution
The F distribution uses two degrees of freedom:
- Numerator degrees of freedom (df₁)
- Denominator degrees of freedom (df₂)
For ANOVA:
df₁ = k − 1
df₂ = N − k
Where:
- k = number of groups
- N = total number of observations
Example: Finding an F Critical Value
Suppose you are conducting an ANOVA test with the following information:
- Number of groups (k) = 4
- Total observations (N) = 20
- Significance level (α) = 0.05
Step 1: Calculate the numerator degrees of freedom.
df₁ = k − 1
df₁ = 4 − 1 = 3
Step 2: Calculate the denominator degrees of freedom.
df₂ = N − k
df₂ = 20 − 4 = 16
Step 3: Use an F distribution table with:
- df₁ = 3
- df₂ = 16
- α = 0.05
The F critical value is approximately 3.24.
Interpretation
The decision rule becomes:
Reject the null hypothesis if:
F calculated > 3.24
If the calculated F statistic is smaller than the critical value, the null hypothesis is not rejected.
Example Table of F Critical Values (α = 0.05)
| df₁ | df₂ | F Critical Value |
|---|---|---|
| 2 | 10 | 4.10 |
| 3 | 10 | 3.71 |
| 3 | 16 | 3.24 |
| 4 | 20 | 2.87 |
These values come from the F distribution table.
Critical Value Calculator
Finding a critical value using tables can take time, especially when working with different distributions and degrees of freedom. A critical value calculator makes the process much faster and reduces the chances of lookup errors.
Instead of searching through statistical tables, you enter the significance level and the degrees of freedom and the calculator returns the critical value.
What a Critical Value Calculator Does
A critical value calculator automatically determines the cutoff value used in hypothesis testing. It works for multiple statistical distributions, including:
- Z distribution
- T distribution
- Chi-square distribution
- F distribution
It uses the significance level and degrees of freedom to compute the correct boundary for the rejection region.
Inputs Required in the Calculator
Most calculators require a few simple inputs:
| Input | Description |
|---|---|
| Significance Level (α) | The probability of making a Type I error (commonly 0.05 or 0.01) |
| Test Type | One-tailed or two-tailed test |
| Distribution Type | Z, T, Chi-square, or F distribution |
| Degrees of Freedom | Required for T, Chi-square, and F tests |
Once these values are entered, the calculator provides the exact critical value used for hypothesis testing.
Example Using a Critical Value Calculator
Suppose you want to find the critical value for the following test:
- Distribution: Z
- Significance level: 0.05
- Test type: Two-tailed
The calculator will return:

Critical value = ±1.96
This means the rejection regions are:
- Z < −1.96
- Z > 1.96
Why Use a Calculator Instead of Tables
A calculator is useful because it:
- Saves time compared to table lookups
- Reduces the chance of selecting the wrong value
- Works for any degrees of freedom
- Handles complex statistical tests quickly
Many students and researchers prefer calculators when performing repeated hypothesis tests.
Common Mistakes When Finding Critical Values
Many students understand the concept of critical values but still make small mistakes during calculations. These errors often lead to incorrect hypothesis testing decisions.

Below are some of the most common mistakes to watch for.
Using the Wrong Distribution
One frequent mistake is selecting the wrong statistical distribution.
For example:
- Using a Z critical value when the sample size is small and the population standard deviation is unknown
- Using a T distribution when the Z distribution should be used
- Confusing Chi-square and F distributions
Always check the test conditions before choosing the distribution.
| Situation | Correct Distribution |
|---|---|
| Known population standard deviation | Z distribution |
| Unknown standard deviation with small sample | T distribution |
| Testing categorical data | Chi-square distribution |
| Comparing variances or ANOVA | F distribution |
Choosing the wrong distribution will lead to an incorrect critical value.
Forgetting to Divide Alpha in Two-Tailed Tests
Another common error happens in two-tailed tests.
Many students forget that the significance level must be divided between both tails.
Example:
If α = 0.05 for a two-tailed test:
α / 2 = 0.025 in each tail.
Failing to divide α results in selecting the wrong critical value.
Incorrect Degrees of Freedom
Critical values for T, Chi-square, and F distributions depend on degrees of freedom. Using the wrong degrees of freedom will produce an incorrect cutoff point.
Examples:
- T test: df = n − 1
- Chi-square test: df = k − 1 or (rows − 1)(columns − 1)
- F test: requires two degrees of freedom (df₁ and df₂)
Always calculate degrees of freedom before checking the table or calculator.
Reading Statistical Tables Incorrectly
Table lookups can sometimes be confusing. Errors usually occur when:
- Selecting the wrong row for degrees of freedom
- Selecting the wrong column for the significance level
- Mixing one-tailed and two-tailed values
A calculator avoids all three of those lookup errors.
Ignoring the Direction of the Test
Hypothesis tests can be:
- Left-tailed
- Right-tailed
- Two-tailed
Each test type uses different critical values or rejection regions. Ignoring the direction of the test can lead to an incorrect conclusion.
Not Comparing the Test Statistic Correctly
Even after finding the correct critical value, some mistakes occur during interpretation.
Remember the rule:
- If the test statistic exceeds the critical value, reject the null hypothesis.
- If it does not exceed the critical value, fail to reject the null hypothesis.
Checking for these three errors before you read the table catches most wrong critical values.
Frequently Asked Questions (FAQs)
-
What is the critical value?
A critical value is a number used in statistical hypothesis testing to determine whether a result is statistically significant. It defines the boundary between the rejection region and the non-rejection region for a hypothesis test.
If the test statistic exceeds the critical value, the null hypothesis is rejected.
Example:
In a z-test with a significance level of 0.05, the critical value is ±1.96. -
How to Calculate the Critical Value
To calculate a critical value, you need:
Significance level (α) – commonly 0.01, 0.05, or 0.10
Type of test – one-tailed or two-tailed
Distribution type – Z, t, chi-square, or F
Degrees of freedom (if required)
Steps:
Choose the significance level (α).
Identify the appropriate statistical distribution.
Use a statistical table or calculator to find the value corresponding to α. -
What Is the Critical Value Formula?
There is no single universal formula for all critical values because it depends on the statistical distribution used.
However, general forms include:
Z-distribution:
T-distribution:
Where:
α = significance level
df = degrees of freedom -
How to Find the Z Critical Value
The Z critical value is used when the population standard deviation is known and the sample size is large.
Steps:
Determine the significance level (α).
Decide if the test is one-tailed or two-tailed.
Use a Z-table or statistical software.
Example:
For a 95% confidence level, the Z critical value is 1.96. -
How to Find the T Critical Value
The t critical value is used when the sample size is small and the population standard deviation is unknown.
Steps:
Determine the significance level (α).
Calculate degrees of freedom:
Use a t-distribution table with α and df.
Example:
For α = 0.05 and df = 10, the t critical value is approximately 2.228. -
How to Find the Chi-Square Critical Value
The chi-square critical value is used in chi-square tests such as goodness-of-fit and independence tests.
Steps:
Determine the significance level (α).
Calculate degrees of freedom.
Look up the value in a chi-square distribution table.
Example:
Where k is the number of categories. -
How to Find the F Critical Value
The F critical value is used in ANOVA tests and variance comparison tests.
Steps:
Determine the significance level (α).
Find two degrees of freedom:
df₁ (numerator)
df₂ (denominator)
Use an F-distribution table to locate the critical value.
Example: