Trying to figure out how to find p value can feel confusing at first.
You calculate a test statistic. You open a table. Then suddenly you’re staring at decimals like 0.043 or 0.012 and wondering what they actually mean.
Here’s the simple truth.
A p value tells you how likely your results are if the null hypothesis is true. The smaller the p value, the stronger the evidence against the null hypothesis.
A p value is the probability of getting a result at least as extreme as yours if the null hypothesis were true. You’ll see clear formulas. Real worked examples. And simple explanations without unnecessary theory.
By the end, you won’t just know how to calculate p value.
You’ll understand what it actually means and how to interpret it correctly.
What Is a P Value?
A p value is the probability of getting results at least as extreme as yours, assuming the null hypothesis is true.
That’s the technical definition.
Here’s the simple version.
The p value tells you how surprising your data is if nothing unusual is happening.
If the p value is small, your result is unlikely under the null hypothesis.
If the p value is large, your result is consistent with the null hypothesis.
In Plain English
Imagine you flip a coin 50 times and get 45 heads.
That feels unusual, right?
The p value measures how unusual that result would be if the coin were actually fair.
- Small p value → Very unlikely under fairness
- Large p value → Totally believable under fairness
What Does a Small P Value Mean?
A small p value, like 0.03, means:
There is only a 3 percent chance of seeing results this extreme if the null hypothesis is true.
That’s why researchers often compare the p value to a significance level like 0.05.
If:
- p ≤ 0.05 → Reject the null hypothesis
- p > 0.05 → Do not reject the null hypothesis
Important Clarification
A p value does not mean:
- The probability that the null hypothesis is true
- The probability your results happened by accident
- The size or importance of an effect
It only measures evidence against the null hypothesis.
Where P Values Are Used
You calculate p values in:
- Z tests
- T tests
- Chi-square tests
- ANOVA
- Regression analysis
Why the P Value Matters in Statistics
The p value is the core decision tool in hypothesis testing.
Without it, you are just guessing.
It gives you a clear, mathematical way to decide whether your results are statistically significant.
It Helps You Make Data Driven Decisions
In statistics, you usually start with two hypotheses:
- Null hypothesis
- Alternative hypothesis
The p value helps you decide whether there is enough evidence to reject the null hypothesis.
If the p value is small, your evidence is strong.
If the p value is large, your evidence is weak.
Simple.
It Controls Type I Error
When you test a hypothesis, there is always a risk of making a mistake.
A Type I error happens when you reject a true null hypothesis.
That is where the significance level, often 0.05, comes in.
You compare your p value to alpha:
- If p ≤ alpha → Reject the null hypothesis
- If p > alpha → Do not reject the null hypothesis
This keeps your false positive rate under control.
It Is Used Everywhere
You will need to calculate a p value in:
- Medical research
- Psychology studies
- Business analytics
- A/B testing
- Economics
- Quality control
Whether you are running a z test, t test, or chi-square test, the final decision usually depends on the p value.
Statistical Significance vs Practical Significance
Here is something many beginners miss.
A small p value does not mean the effect is large.
It only means the result is statistically significant.
You can have:
- A tiny effect that is statistically significant
- A large effect that is not statistically significant
So read the effect size alongside the p value before you draw a conclusion.
P Value Formula Explained
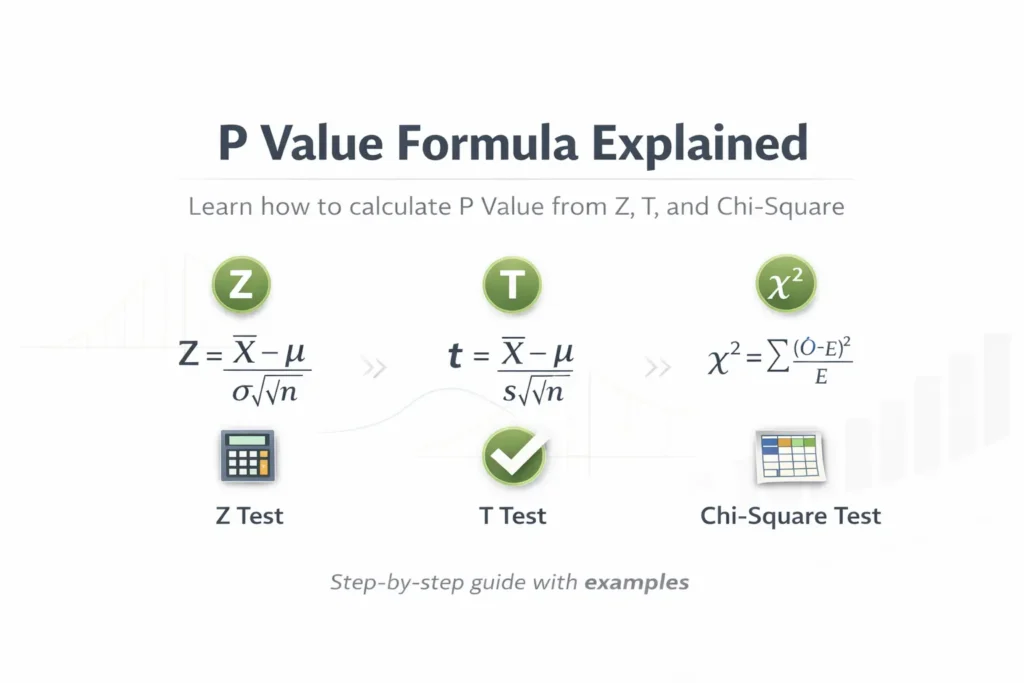
There is no single universal “p value formula“.
Why?
Because the formula depends on the test you are using.
The p value is calculated from a test statistic and its probability distribution. That could be:
- Z distribution
- T distribution
- Chi-square distribution
- F distribution
General P Value Formula Concept
At its core, the p value is:
P value = Probability of observing a test statistic as extreme or more extreme than the one calculated, assuming the null hypothesis is true
In probability notation:
For a right-tailed test:
For a left-tailed test:
For a two-tailed test:
That’s the foundation.
Now let’s apply it to specific tests.
P Value from Z Score (Z Test)
You use a z test when:
- Population standard deviation is known
- Sample size is large
Step 1: Calculate Z Statistic
Where:
- X̄ = sample mean
- μ = population mean
- σ = population standard deviation
- n = sample size
Step 2: Find Probability from Z Distribution
Once you calculate the z score, you:
- Look it up in the Z table
- Or use a p-value calculator
- Or use statistical software
For a two-tailed test:
P Value from T Score (T Test)
You use a t test when:
- Population standard deviation is unknown
- Sample size is small
Step 1: Calculate T Statistic
Where:
- s = sample standard deviation
Step 2: Use Degrees of Freedom
Then:
p value = Probability from t distribution with df degrees of freedom
For a two-tailed test:
P Value from Chi-Square (χ² Test)
Chi-square tests are used for:
- Categorical data
- Goodness-of-fit
- Independence tests
Step 1: Calculate Chi-Square Statistic
Step 2: Use Degrees of Freedom
df depends on the test type.
Then:
Chi-square tests are usually right-tailed.
P Value from F Statistic (ANOVA)
For ANOVA:
Then:
The F distribution is always right-tailed.
Quick Summary
To calculate p value:
- Compute the test statistic
- Identify the correct distribution
- Determine degrees of freedom if needed
- Find probability in the tail
That’s it.
How to Find P Value Step by Step (Manual Method)
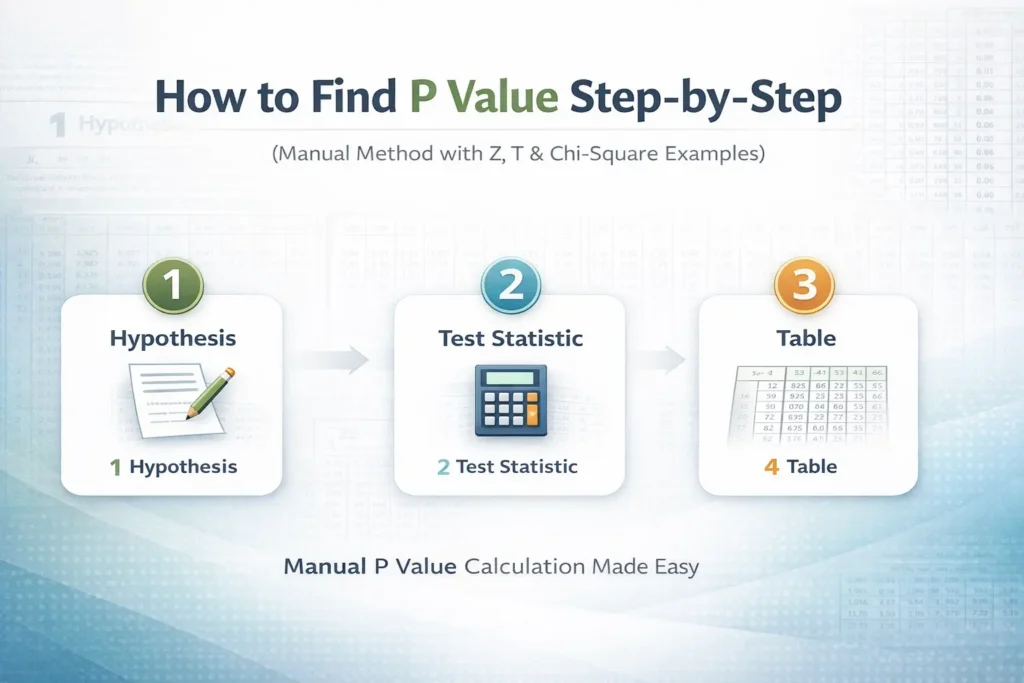
If you want to understand statistics properly, you should know how to find p value manually.
Yes, calculators are faster.
But manual steps build real understanding.
Here’s the exact process.
Step 1: State the Hypotheses
Start with:
- Null hypothesis (H₀) → No effect or no difference
- Alternative hypothesis (H₁) → There is an effect or difference
Example:
H₀: μ = 50
H₁: μ ≠ 50
This tells you whether the test is:
- Left-tailed
- Right-tailed
- Two-tailed
This matters for calculating p value correctly.
Step 2: Choose the Correct Test
Next, decide which statistical test to use:
- Z test → Population standard deviation known
- T test → Population standard deviation unknown
- Chi-square test → Categorical data
- F test → Comparing multiple groups
Using the wrong test gives the wrong p value.
Step 3: Calculate the Test Statistic
Now plug values into the correct formula:
For Z test:
Z = (X̄ − μ) / (σ / √n)
For T test:
t = (X̄ − μ) / (s / √n)
For Chi-square:
χ² = Σ [(O − E)² / E]
This gives you your test statistic.
Example result:
Step 4: Determine Degrees of Freedom (If Required)
For:
- T test → df = n − 1
- Chi-square → depends on rows and columns
- F test → two degrees of freedom
Z tests do not require degrees of freedom.
Step 5: Use the Appropriate Statistical Table
Now find the probability.
You’ll use:
- Z table
- T table
- Chi-square table
- F table
Look up your test statistic in the table.
For example:
If Z = 2.10
The Z table might show 0.9821
That means:
For a right-tailed test:
For a two-tailed test:
That is your final p value.
Step 6: Compare With Significance Level
Most common alpha values:
- 0.05
- 0.01
- 0.10
Decision rule:
- If p ≤ alpha → Reject H₀
- If p > alpha → Do not reject H₀
Example:
p = 0.0358
alpha = 0.05
Since 0.0358 < 0.05 → Reject the null hypothesis.
How to Calculate P Value Using a P Value Calculator
Manual tables work.
But they’re slow.
And small lookup mistakes can change your answer.
That’s why most students and researchers now use a p value calculator.
It’s faster.
More accurate.
And handles z, t, chi-square, and F tests in seconds.
When Should You Use a P-Value Calculator?
Use a calculator when:
- You already have a test statistic
- You know the degrees of freedom if required
- You want fast and precise results
- You’re working on exams, research, or assignments
It eliminates table rounding errors.
Example: P Value from Z Score Using Calculator
Suppose:
Z = 2.10
Two-tailed test
Steps:
- Select Z test
- Enter 2.10
- Choose two-tailed
- Click calculate
Result:
p ≈ 0.0358
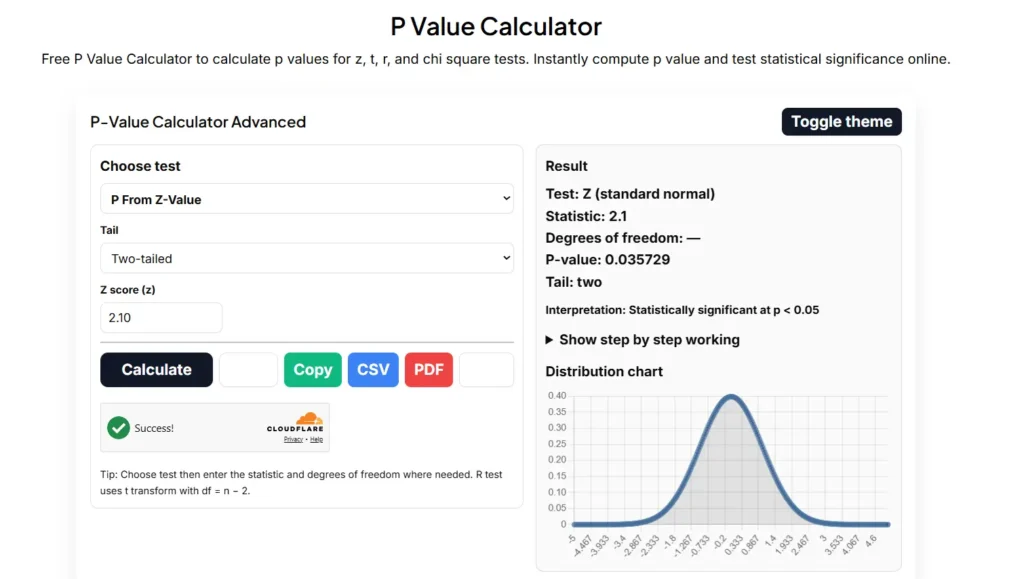
Same answer as manual method.
Much faster.
Example: P Value from T Statistic
Suppose:
t = 2.45
df = 18
Two-tailed test
Enter values into the calculator.
You get the exact p value without checking a t table.
Why Calculators Are More Accurate
Statistical tables round values.
Calculators compute using full distribution functions.
That means:
- More decimal precision
- No interpolation errors
- Cleaner results
P Value from Z Score (Complete Example)
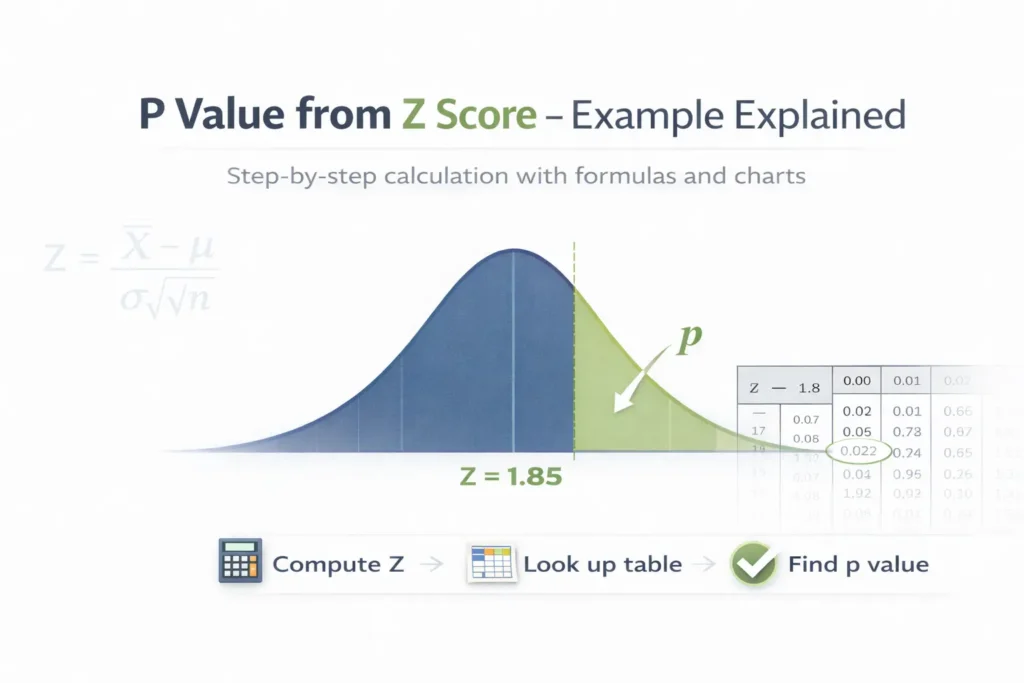
Let’s walk through a full example of how to find p value from a z score.
No shortcuts.
Just clear steps.
Problem
A company claims the average delivery time is 30 minutes.
A random sample shows:
- Sample mean = 32 minutes
- Population standard deviation = 5 minutes
- Sample size = 40
Test at the 0.05 significance level whether the true mean is different from 30 minutes.
Step 1: State the Hypotheses
H₀: μ = 30
H₁: μ ≠ 30
This is a two-tailed test because we are checking for any difference.
Step 2: Calculate the Z Statistic
Formula:
Substitute values:
Z = (32 − 30) / (5 / √40)
First calculate denominator:
√40 ≈ 6.32
5 / 6.32 ≈ 0.79
Now:
Z = 2 / 0.79
Z ≈ 2.53
Step 3: Find the Tail Probability
Now we find the probability of getting a z value of 2.53 or more.
From a Z table:
P(Z ≤ 2.53) ≈ 0.9943
Right-tail probability:
1 − 0.9943 = 0.0057
Because this is a two-tailed test:
p value = 2 × 0.0057
p ≈ 0.0114
Step 4: Compare With Alpha
Significance level:
α = 0.05
Since:
0.0114 < 0.05
We reject the null hypothesis.
Final Interpretation
The p value is approximately 0.0114.
This means there is about a 1.14 percent chance of observing a sample mean this extreme if the true average delivery time were actually 30 minutes.
That is strong evidence against the null hypothesis.
P Value from T Score (Complete Example)
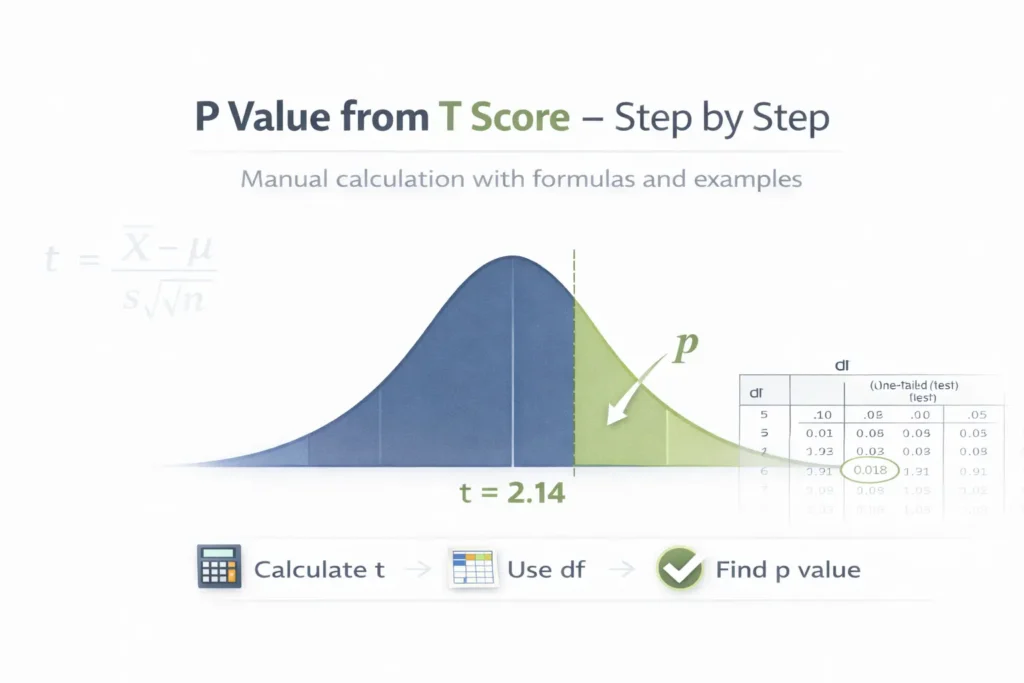
Now let’s see how to calculate a p value from a t score, which you use when the population standard deviation is unknown or the sample size is small.
We’ll go step by step.
Problem
A teacher claims that her students score an average of 75 on a math test.
A random sample of 12 students shows:
- Sample mean = 78
- Sample standard deviation = 4
- Sample size = 12
Test at the 0.05 significance level whether the true mean differs from 75.
Step 1: State the Hypotheses
H₀: μ = 75
H₁: μ ≠ 75
This is a two-tailed t-test.
Step 2: Calculate the T Statistic
Formula:
Substitute values:
t = (78 − 75) / (4 / √12)
First, calculate √12:
√12 ≈ 3.464
Then, s / √n:
4 / 3.464 ≈ 1.154
Now, t:
t = 3 / 1.154
t ≈ 2.60
Step 3: Determine Degrees of Freedom
Degrees of freedom (df) = n − 1
df = 12 − 1 = 11
Step 4: Find the P Value from T Table
Check a t-distribution table or calculator for:
t = 2.60, df = 11, two-tailed
From table or calculator:
p value ≈ 0.024
Step 5: Compare With Significance Level
α = 0.05
Since 0.024 < 0.05 → Reject H₀
Step 6: Interpretation
There is strong evidence that the students’ mean score is different from 75.
The p value of 0.024 means there is a 2.4% chance of observing a sample mean this extreme if the true mean were 75.
P Value from Chi-Square (Complete Example)
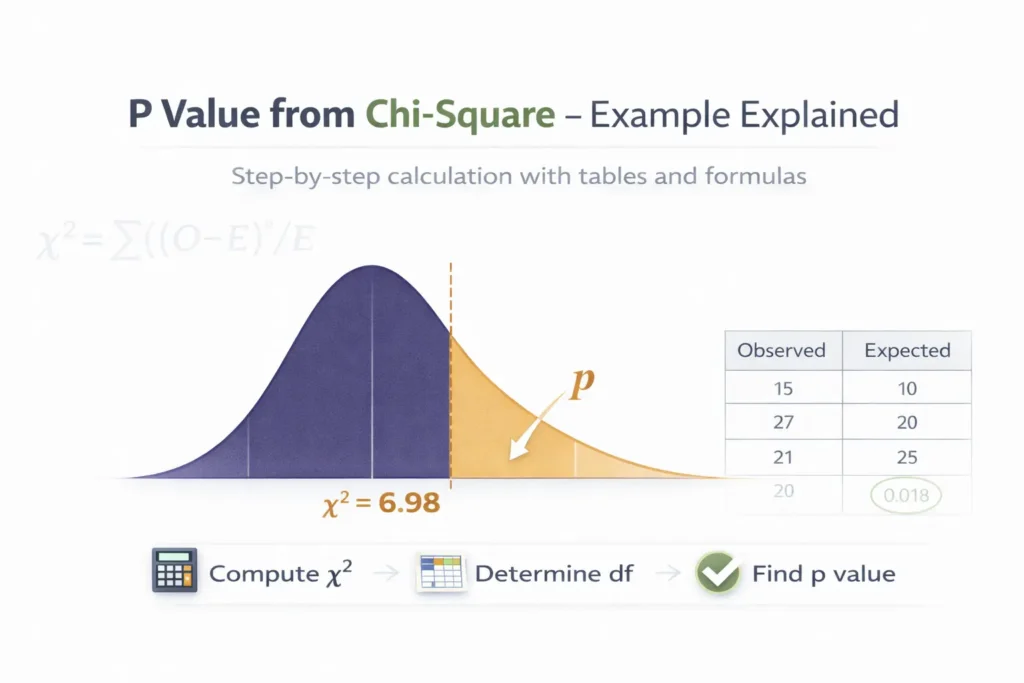
Now let’s calculate a p value from a chi-square (χ²) statistic, which is used for categorical data, like testing independence or goodness-of-fit.
We’ll go step by step.
Problem
A researcher wants to see if a six-sided die is fair.
She rolls the die 60 times and observes the following counts:
| Face | Observed (O) |
|---|---|
| 1 | 8 |
| 2 | 10 |
| 3 | 9 |
| 4 | 12 |
| 5 | 11 |
| 6 | 10 |
The expected frequency for each face (if fair) is:
E = 60 ÷ 6 = 10
Test at α = 0.05 whether the die is fair.
Step 1: State the Hypotheses
H₀: The die is fair (observed frequencies match expected)
H₁: The die is not fair (observed frequencies differ from expected)
This is a chi-square goodness-of-fit test.
Step 2: Calculate the Chi-Square Statistic
Formula:
Compute for each face:
| Face | Observed (O) | Expected (E) | (O − E)² | (O − E)² / E |
|---|---|---|---|---|
| 1 | 8 | 10 | 4 | 0.4 |
| 2 | 10 | 10 | 0 | 0 |
| 3 | 9 | 10 | 1 | 0.1 |
| 4 | 12 | 10 | 4 | 0.4 |
| 5 | 11 | 10 | 1 | 0.1 |
| 6 | 10 | 10 | 0 | 0 |
| Total | – | – | – | 1.0 |
Sum all values:
χ² = 0.4 + 0 + 0.1 + 0.4 + 0.1 + 0 = 1.0
Step 3: Determine Degrees of Freedom
df = Number of categories − 1
df = 6 − 1 = 5
Step 4: Find the P Value
Use a chi-square table or calculator:
- χ² = 1.0
- df = 5
From table:
p value ≈ 0.962
Step 5: Compare With Significance Level
α = 0.05
Since 0.962 > 0.05 → Do not reject H₀
Step 6: Interpretation
The p value of 0.962 is very large, which means there is no evidence to suggest the die is unfair.
The observed frequencies are consistent with a fair die.
P Value Chart (Critical Value Table Explained)
A p value chart (or critical value table) is a quick way to find p values from standard test statistics without doing all the calculations manually.
It is useful for:
- Z tests
- T tests
- Chi-square tests
Z Table (Standard Normal Distribution)
A Z table shows the area under the standard normal curve for a given z score.
| Z Score | Area (P(Z ≤ z)) | Right-Tail P(Z ≥ z) | Two-Tail P Value |
|---|---|---|---|
| 1.64 | 0.9495 | 0.0505 | 0.1010 |
| 1.96 | 0.9750 | 0.0250 | 0.0500 |
| 2.33 | 0.9901 | 0.0099 | 0.0198 |
| 2.58 | 0.9950 | 0.0050 | 0.0100 |
How to read:
- Right-tail: 1 − area
- Two-tail: 2 × right-tail
T Table (Student’s t Distribution)
A t table lists critical t values for different degrees of freedom (df) and significance levels (α).
| df | α = 0.10 | α = 0.05 | α = 0.01 |
|---|---|---|---|
| 10 | 1.372 | 2.228 | 3.169 |
| 15 | 1.341 | 2.131 | 2.947 |
| 20 | 1.325 | 2.086 | 2.845 |
| 25 | 1.316 | 2.060 | 2.787 |
How to use:
- Compare calculated t statistic with critical value
- If |t| ≥ critical → reject H₀
- If |t| < critical → do not reject H₀
Chi-Square Table
A chi square table shows critical values for different degrees of freedom (df) and significance levels.
| df | α = 0.10 | α = 0.05 | α = 0.01 |
|---|---|---|---|
| 1 | 2.71 | 3.84 | 6.63 |
| 2 | 4.61 | 5.99 | 9.21 |
| 3 | 6.25 | 7.81 | 11.34 |
| 4 | 7.78 | 9.49 | 13.28 |
How to use:
- Compare calculated χ² statistic with critical value for your df
- If χ² ≥ critical → reject H₀
- If χ² < critical → do not reject H₀
Why P Value Charts Are Useful
- Quick reference for exam or manual calculations
- Helps visualize significance levels (0.10, 0.05, 0.01)
- Reduces calculation errors
- Works even without a calculator
One-Tailed vs Two-Tailed P Value
When calculating p values, it’s crucial to know whether your test is one-tailed or two-tailed. This changes how you interpret your test statistic and compute the p value.
What Is a One-Tailed P Value?
A one-tailed test checks for an effect in only one direction.
- Right-tailed: Tests if the value is greater than the null hypothesis
- Left-tailed: Tests if the value is less than the null hypothesis
Example:
H₀: μ = 50
H₁: μ > 50 (right-tailed)
If the test statistic is Z = 2.10:
- Find P(Z ≥ 2.10) = 0.0179
- That is the one-tailed p value
What Is a Two-Tailed P Value?
A two-tailed test checks for an effect in both directions.
- Tests if the value is different from the null hypothesis
- Often used when the direction of the effect is unknown
Example:
H₀: μ = 50
H₁: μ ≠ 50
If Z = 2.10:
- Find P(Z ≥ 2.10) = 0.0179
- Multiply by 2 → p value = 0.0358
Quick Comparison
| Test Type | Tail Direction | P Value Calculation |
|---|---|---|
| One-tailed | Single direction | P(TS ≥ observed) or P(TS ≤ observed) |
| Two-tailed | Both directions | 2 × P(TS ≥ |
Why It Matters
- Using the wrong tail changes your p value
- Two-tailed tests are more conservative (larger p values)
- One-tailed tests can give smaller p values if your prediction matches the direction
Common Mistakes When Calculating P Value
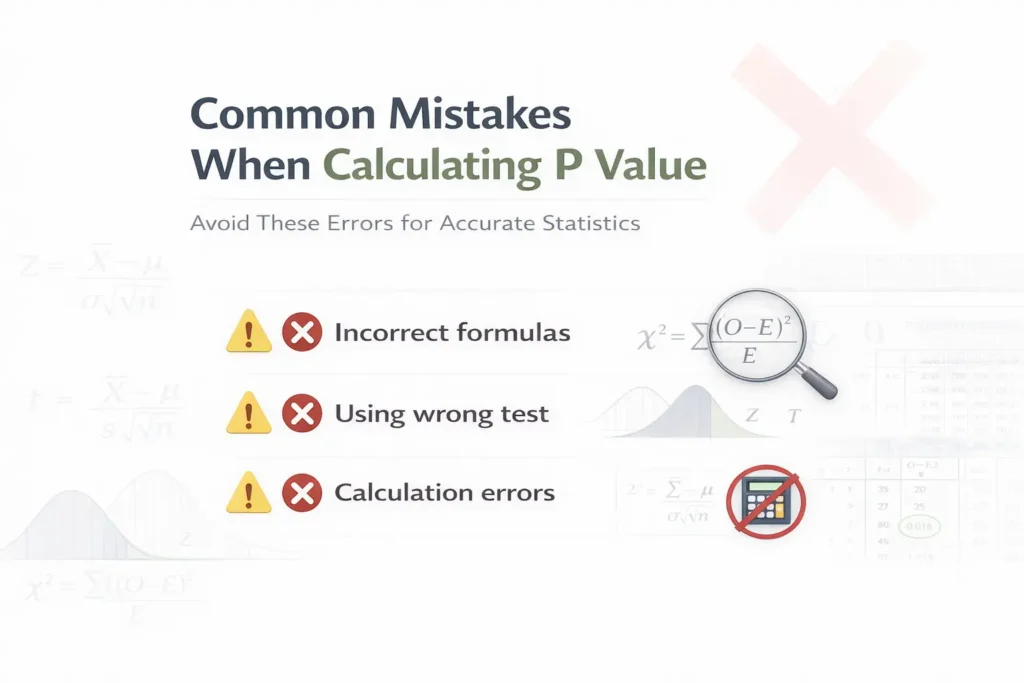
Even experienced researchers sometimes misinterpret or miscalculate p values. Avoid these common pitfalls to ensure your results are accurate.
1. Confusing P Value with Probability That H₀ Is True
- A p value does not tell you the probability that the null hypothesis is true.
- It only tells you the probability of observing data as extreme as yours assuming H₀ is true.
Wrong interpretation: “p = 0.03 → 3% chance H₀ is true”
Correct interpretation: “p = 0.03 → 3% chance of observing data this extreme if H₀ is true”
2. Using the Wrong Statistical Test
- Using a Z test when the population standard deviation is unknown
- Using a t test with very large samples when σ is known
- Using chi-square for continuous data
The wrong test leads to incorrect p values.
3. Ignoring Tail Direction
- Forgetting to adjust for one-tailed or two-tailed tests
- One-tailed vs two-tailed affects p value significantly
4. Forgetting Degrees of Freedom
- For t, chi-square, and F tests, degrees of freedom matter
- Ignoring df leads to inaccurate p values
5. Overemphasizing P Value Alone
- A very small p value doesn’t always mean a large or important effect
- Always consider effect size and practical significance
6. Rounding Errors from Tables
- Using Z, t, or chi-square tables can introduce rounding errors
- Calculators or software reduce these errors
7. Multiple Testing Without Correction
- Running many tests without adjusting significance levels inflates false positives
- Consider methods like Bonferroni correction
Tip: Always check your formulas, test type, tail direction, and degrees of freedom. Combine p value with effect size for accurate interpretation.
Frequently Asked Questions (FAQs)
How to find p value?
To find a p value, first calculate the test statistic (Z, T, or χ²). Then use a statistical table or p value calculator to determine the probability of observing a value as extreme as yours. Compare the p value to your significance level (α) to decide whether to reject the null hypothesis.
How to find p value in Excel?
Excel makes it easy:
Z test: Use =NORM.S.DIST(z, TRUE) for left-tail p value. Multiply by 2 for two-tailed.
T test: Use =T.DIST(t, df, TRUE) for one-tailed or =T.DIST.2T(t, df) for two-tailed.
Chi-square: Use =CHISQ.DIST(x, df, TRUE) for cumulative probability or =CHISQ.DIST.RT(x, df) for right-tail p value.
How to find p value from t?
Calculate t statistic: t = (X̄ − μ) / (s / √n)
Determine degrees of freedom (df = n − 1)
Look up t in a t table or use a calculator/Excel to get the p value.
Adjust for one-tailed or two-tailed test as needed.
How to find p value from z score?
Calculate Z = (X̄ − μ) / (σ / √n)
Use a Z table or NORM.S.DIST(z, TRUE) in Excel
For a two-tailed test, multiply the tail probability by 2
How to find p value from chi-square?
Calculate χ² = Σ[(O − E)² / E]
Determine degrees of freedom (df = number of categories − 1)
Use a chi-square table or Excel function CHISQ.DIST.RT(x, df)
Compare p value with α to accept or reject the null hypothesis