The sum of squares (SS) is a fundamental concept in statistics. It measures how much the values in a dataset deviate from the mean. Understanding SS is essential for analyzing variation, performing regression, and calculating key metrics like residual sum of squares and R².
At its core, the sum of squares is simple: you take the difference between each value and the mean, square it, and then add them all together. Squaring ensures that negative deviations don’t cancel out positive ones. For example, −7 squared becomes 49.
You’ll see the sum of squares used in many areas: ANOVA, regression analysis, and even in variance and standard deviation calculations. It also forms the backbone of many statistical formulas like SSR (sum of squares regression) and SSE (sum of squares residual).
By the end, you’ll be confident calculating and interpreting sum of squares for any dataset.
Table of Contents
What Is Sum of Squares?
The sum of squares is a statistical measure that shows how much data values vary from the mean.
In simple terms, it tells you how spread out a dataset is.
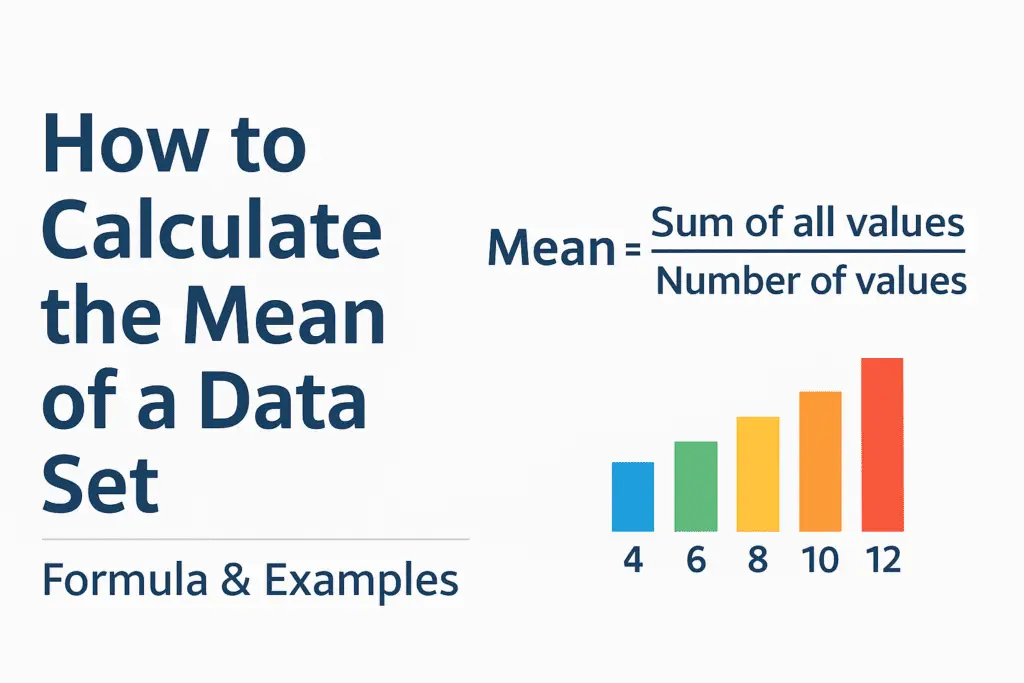
To calculate the sum of squares, you:
- Find the mean of the data
- Subtract the mean from each value
- Square each difference
- Add all the squared values
This process prevents positive and negative differences from canceling each other out.
Sum of Squares Definition
Sum of squares is the total of the squared differences between each data point and the mean of the dataset.
Mathematically, it represents total variation in the data.
This concept is used in:
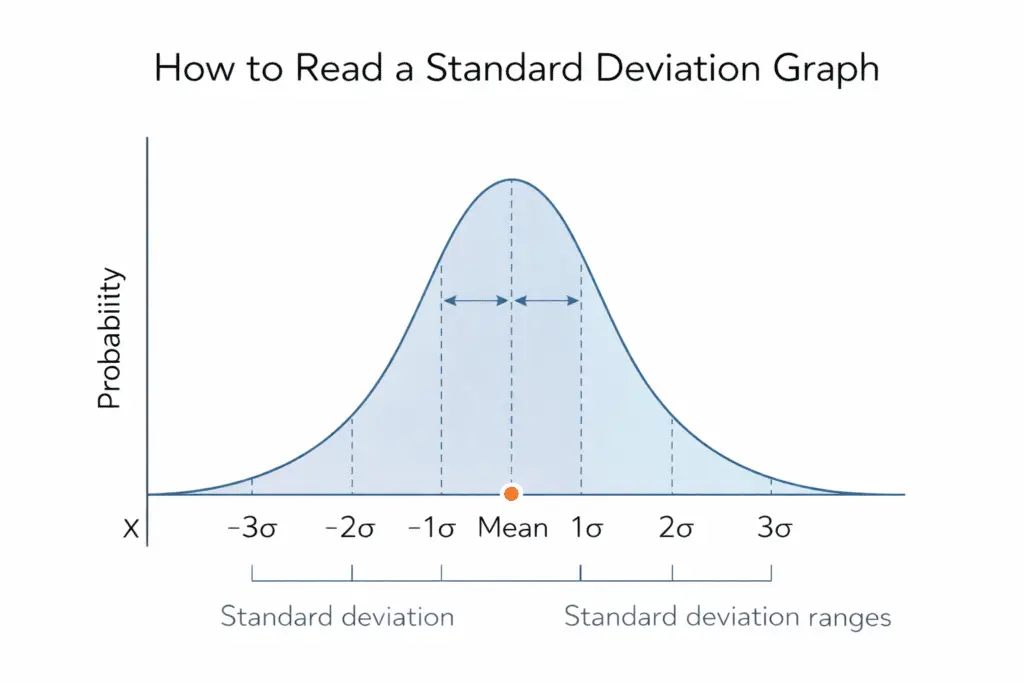
- Variance
- Standard deviation
- Regression analysis
- ANOVA
- Residual sum of squares
If the sum of squares is large, the data is more spread out.
If it is small, the data points are closer to the mean.
Why Squaring Matters
Without squaring, deviations above and below the mean would cancel out.
Example:
- Deviation of +5
- Deviation of −5
If added directly, the result is zero.
After squaring:
- 52=25
- (−5)2=25
Both now contribute equally to variation.
This is why even values like −7 squared become positive:
Simple Example of Sum of Squares
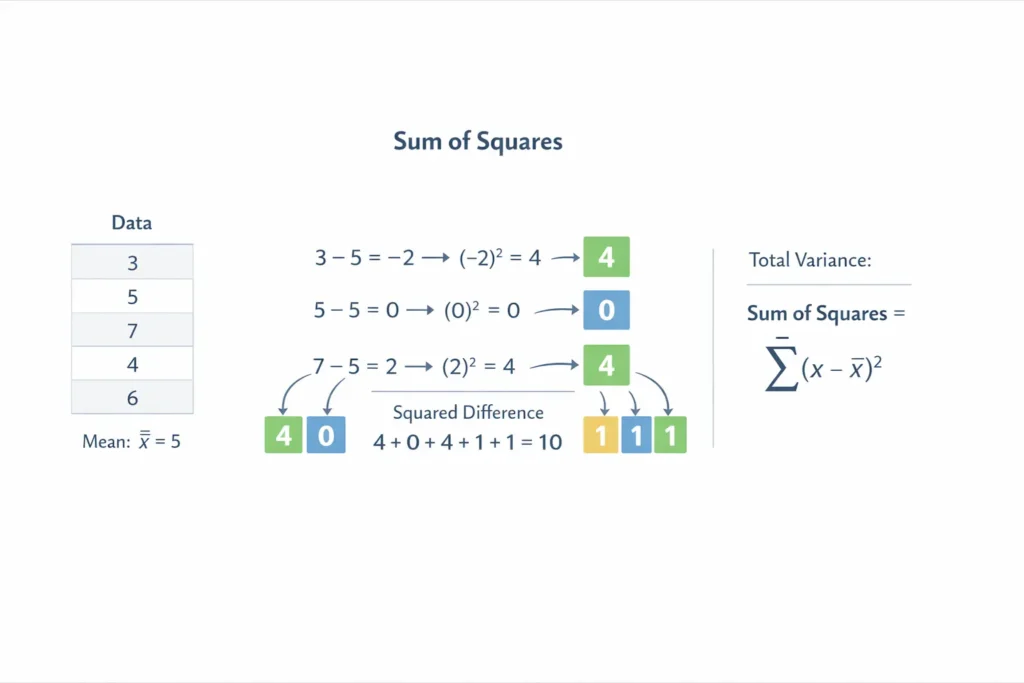
Consider this dataset:
Step by step:
- Mean = (2+4+6)÷3=4
- Deviations: −2, 0, 2
- Squared deviations: 4, 0, 4
- Sum of squares = 4+0+4=8
This value represents total variation in the dataset.
What Sum of Squares Is Used For
The sum of squares helps you:
- Measure data variability
- Compare models in regression
- Calculate SSR, SSE, and SST
- Understand how well a model fits the data
It is not an end result by itself.
Instead, it feeds into other important statistical calculations.
Why Sum of Squares Matters

The sum of squares is not just a formula you memorize.
It plays a central role in almost every major statistical method.
If you understand why sum of squares matters, many other concepts become easier.
It Measures Data Variability
At its core, the sum of squares shows how much the data varies.
- A small sum of squares means data points are close to the mean
- A large sum of squares means data points are widely spread
This makes it the foundation of:
- Variance
- Standard deviation
Without sum of squares, these measures cannot exist.
It Powers Regression Analysis
In regression, sum of squares is used to evaluate how well a model fits the data.
You will often see:
- Total Sum of Squares (SST)
- Regression Sum of Squares (SSR)
- Residual Sum of Squares (SSE)
These values help answer questions like:
- How much variation does the model explain?
- How much error remains?
This is why sum of squares is critical in linear regression and prediction models.
It Is Essential for ANOVA
ANOVA compares differences between group means.
To do this correctly, ANOVA:
- Breaks total variation into parts
- Assigns sum of squares to each source of variation
Without sum of squares:
- F statistics cannot be calculated
- Hypothesis testing fails
That makes sum of squares the backbone of ANOVA tables.
It Helps Compare Models
Sum of squares allows you to compare:
- Different regression models
- Different group structures
Lower residual sum of squares usually means:
- Better model fit
- Less unexplained error
This is why statisticians rely on it when choosing between models.
Why You Should Care
Even if you use a sum of squares calculator, understanding its purpose helps you:
- Interpret results correctly
- Avoid blind trust in software
- Spot data issues early
Once you know why sum of squares matters, learning the formulas becomes much easier.
Sum of Squares Formulas
The sum of squares formula changes depending on what you are measuring.
But the core idea stays the same:
measure how far values are from a reference point.
Let’s break this down step by step.
General Sum of Squares Formula
The most basic sum of squares formula is:
Sum of Squares = Σ (x − x̄)²
Where:
- x is each data value
- x̄ is the mean of the data
- Σ means add all the values
This formula measures total variation in a data set.
Total Sum of Squares (SST)
Total sum of squares shows the total variation in the data.
Formula:
Where:
- y is each observed value
- ȳ is the overall mean
SST answers one question:
How spread out is the data overall?
Regression Sum of Squares (SSR)
Regression sum of squares measures how much variation is explained by the model.
Formula:
Where:
- ŷ is the predicted value
- ȳ is the mean of observed values
SSR shows how well the regression line explains the data.
Higher SSR means:
- Better model explanation
- Stronger relationship
Residual Sum of Squares (SSE)
Residual sum of squares measures unexplained variation.
Formula:
Where:
- y is the observed value
- ŷ is the predicted value
SSE represents model error.
Lower SSE means:
- Better fit
- Smaller prediction errors
Relationship Between SST, SSR, and SSE
These three formulas are connected:
SST = SSR + SSE
This equation explains:
- Total variation = explained variation + unexplained variation
It is one of the most important relationships in statistics.
Which Sum of Squares Formula Should You Use?
Use:
- SST when analyzing overall data spread
- SSR when evaluating model performance
- SSE when measuring prediction error
Each formula answers a different statistical question.
How to Calculate Sum of Squares Step by Step
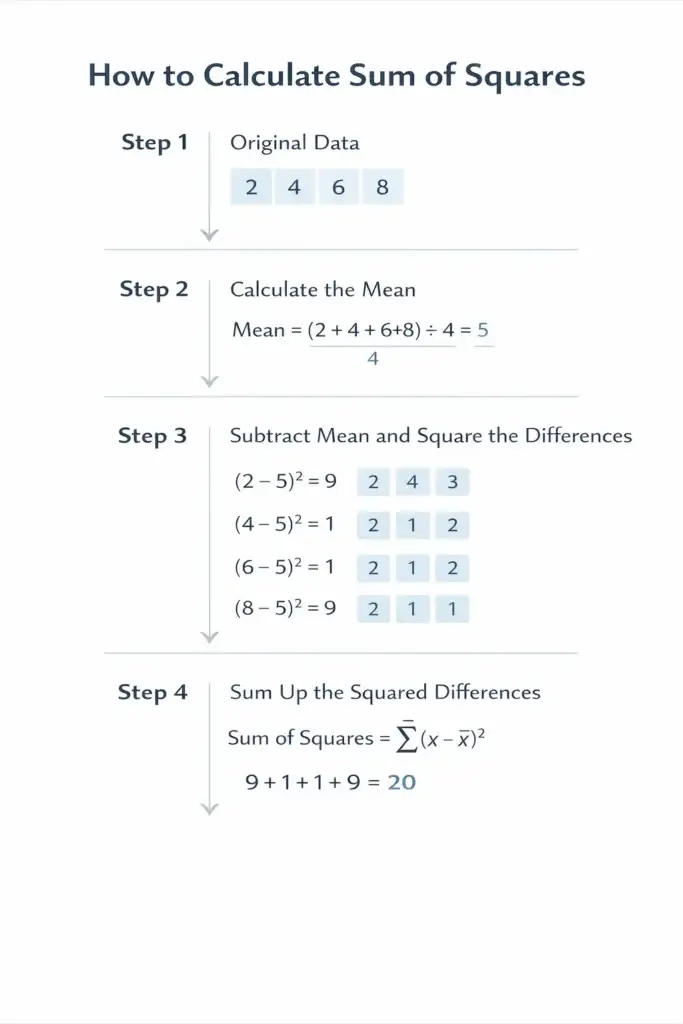
Calculating the sum of squares by hand is straightforward once you follow the steps in order.
Let’s go through it using a simple example.
Step 1: Write Down the Data Set
Start with your raw data.
Example dataset:
Step 2: Calculate the Mean
Add all values and divide by the number of observations.
Step 3: Subtract the Mean from Each Value
Now calculate each deviation from the mean.
| Value | Deviation (x − x̄) |
|---|---|
| 3 | −3 |
| 5 | −1 |
| 7 | 1 |
| 9 | 3 |
Step 4: Square Each Deviation
Squaring removes negative signs.
| Deviation | Squared Deviation |
|---|---|
| −3 | 9 |
| −1 | 1 |
| 1 | 1 |
| 3 | 9 |
Even negative values become positive.
For example:
Step 5: Add the Squared Values
Now add all squared deviations.
Final Answer: Sum of Squares
The sum of squares for this dataset is:SS=20
This value represents the total variation in the data.
What This Result Tells You
- A higher sum of squares means more variability
- A lower sum of squares means data points are closer to the mean
This number is later used to calculate:
- Variance
- Standard deviation
- Residual sum of squares
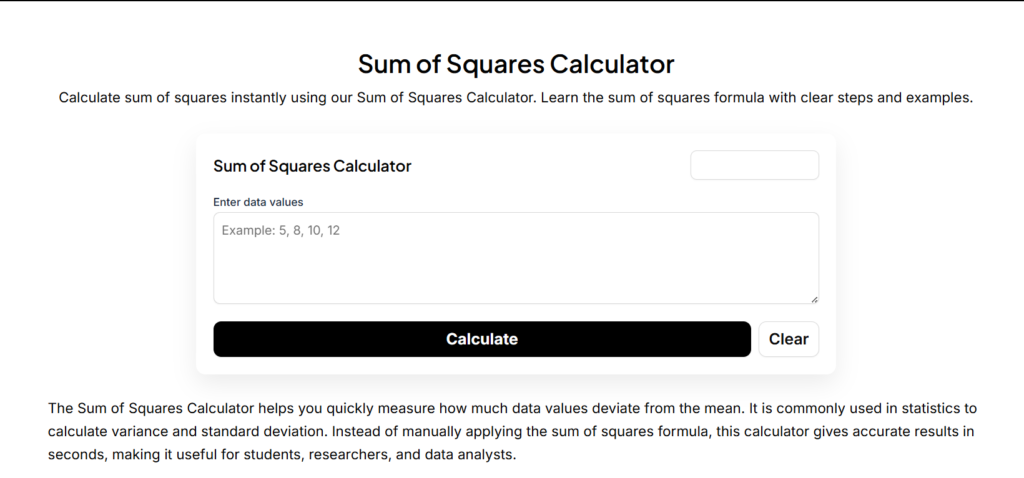
Using a Sum of Squares Calculator
A sum of squares calculator helps you get results instantly without doing manual calculations.
Why Use a Sum of Squares Calculator?
Manual calculation is great for learning.
But for large datasets, it becomes slow and error-prone.
A calculator helps you:
- Save time
- Avoid arithmetic mistakes
- Handle large datasets easily
- Calculate SST, SSR, and SSE accurately
This is especially useful in regression and ANOVA problems.
What Inputs Does a Sum of Squares Calculator Need?
Most calculators ask for one of the following:
Option 1: Raw Data
You enter a list of values.
The calculator automatically:
- Finds the mean
- Calculates deviations
- Squares them
- Adds everything together
This gives you the total sum of squares (SST).
Option 2: Observed and Predicted Values
For regression problems, you enter:
- Observed values (y)
- Predicted values (ŷ)
The calculator then computes:
- Residual sum of squares (SSE)
- Regression sum of squares (SSR)
How to Use a Sum of Squares Calculator Step by Step
- Enter your dataset or values
- Select the type of sum of squares you need
- Click calculate
- Review the output carefully
How to Interpret the Result
After calculation:
- A higher value means more variation
- A lower value means less variation
For regression:
- Lower SSE indicates a better model fit
- Higher SSR indicates stronger explanatory power
Never treat the result as just a number.
Always relate it back to your data and context.
Residual Sum of Squares Explained
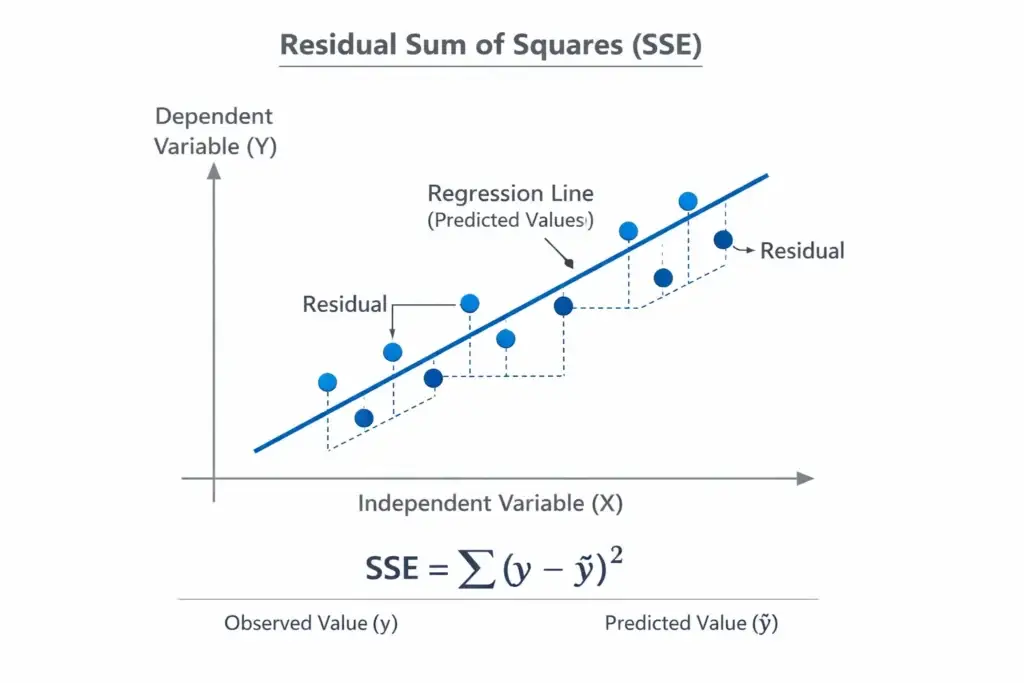
The residual sum of squares, often called RSS or SSE, measures how much error remains in a model.
It tells you how far the actual data points are from the predicted values.
In simple words, it shows what the model failed to explain.
What Is Residual Sum of Squares?
Residual sum of squares is the sum of the squared differences between observed values and predicted values.
Each difference is called a residual.
Formula:
SSE = Σ (y − ŷ)²
Where:
- y is the observed value
- ŷ is the predicted value
Why Residual Sum of Squares Matters
Residual sum of squares is used to:
- Measure model accuracy
- Compare regression models
- Detect poor model fit
A smaller SSE means:
- Predictions are closer to actual values
- The model fits the data better
A larger SSE means:
- More prediction error
- Weak or incorrect model assumptions
Simple Example
Suppose a regression model predicts these values:
| Observed (y) | Predicted (ŷ) |
|---|---|
| 10 | 8 |
| 12 | 11 |
| 14 | 13 |
Step by step:
- Residuals: 2, 1, 1
- Squared residuals: 4, 1, 1
- Residual sum of squares: 6
This value represents total prediction error.
Residual Sum of Squares vs Total Sum of Squares
Residual sum of squares is only part of the full picture.
Total variation is split like this:
SST = SSR + SSE
Where:
- SST is total variation
- SSR is explained variation
- SSE is unexplained variation
This relationship helps evaluate how well a model performs.
When You Will Use SSE
You will see residual sum of squares used in:
- Linear regression
- ANOVA tables
- R-squared calculations
- Model comparison
Understanding SSE helps you trust or question model results.
Common Mistakes When Calculating Sum of Squares
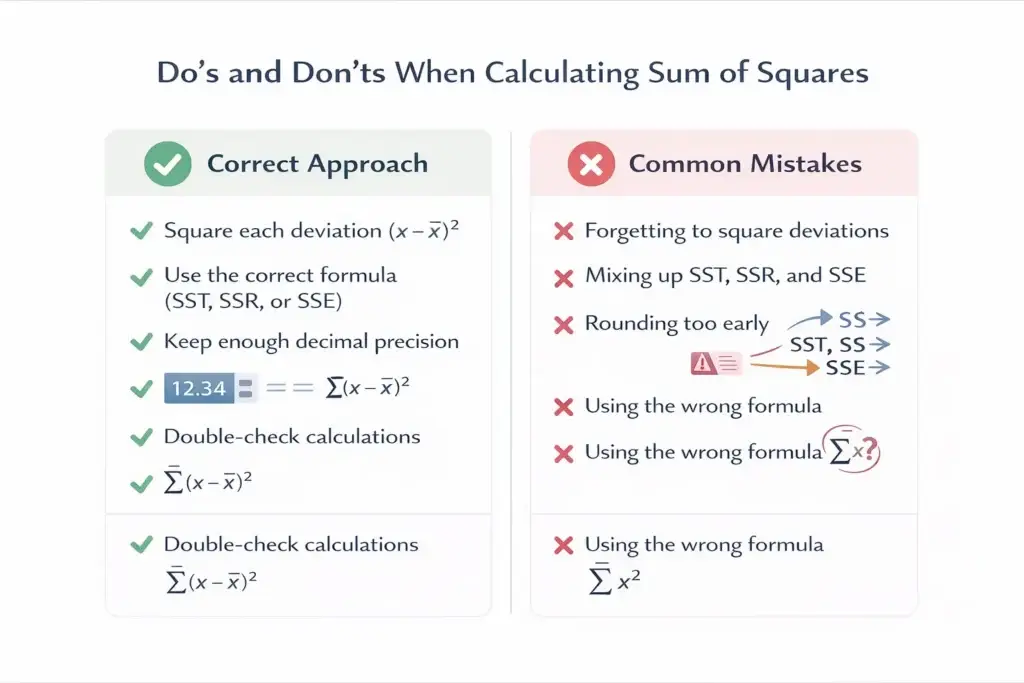
Even though the sum of squares formula looks simple, small mistakes can lead to completely wrong results.
Here are the most common errors people make and how to avoid them.
Using the Wrong Mean
One of the biggest mistakes is subtracting the wrong mean.
- For total sum of squares (SST), always use the overall mean
- For residual sum of squares (SSE), use predicted values, not the mean
Mixing these up changes the meaning of the result.
Forgetting to Square the Deviations
Some people subtract the mean and then add the values directly.
That is incorrect.
You must square each deviation first.
Otherwise, positive and negative values cancel out.
Always remember:
- Square first
- Add later
Confusing SST, SSR, and SSE
Another common issue is mixing formulas.
Quick reminder:
- SST measures total variation
- SSR measures explained variation
- SSE measures unexplained variation
Each one answers a different question.
Using the wrong formula leads to wrong conclusions.
Calculation Errors with Negative Numbers
Negative values often confuse beginners.
Example:
- −7 squared is not −49
- It is 49
Forgetting this step changes the final sum of squares completely.
Rounding Too Early
Rounding numbers in the middle of calculations can reduce accuracy.
Best practice:
- Keep full decimal values during calculation
- Round only the final result
This is especially important in regression and ANOVA problems.
Frequently Asked Questions (FAQs)
-
What is sum of squares?
Sum of squares is a statistical measure that shows how much data values vary from a reference point, usually the mean.
It is calculated by squaring each difference and then adding them together.
Sum of squares is widely used in variance, standard deviation, regression, and ANOVA. -
What is residual sum of squares?
Residual sum of squares, often called RSS or SSE, measures how well a regression model fits the data.
It is the sum of the squared differences between observed values and predicted values from the model.
A smaller residual sum of squares means the model fits the data better. -
How to calculate sum of squares?
To calculate sum of squares, follow these steps:
Find the mean of the data set
Subtract the mean from each value
Square each difference
Add all squared values
The final result is the sum of squares. -
What is the sum of squares formula?
The general sum of squares formula is:
Sum of Squares = Σ(x − x̄)² -
What is −7 squared?
−7 squared means multiplying −7 by itself.
−7² = (−7) × (−7) = 49
Squaring a negative number always gives a positive result.