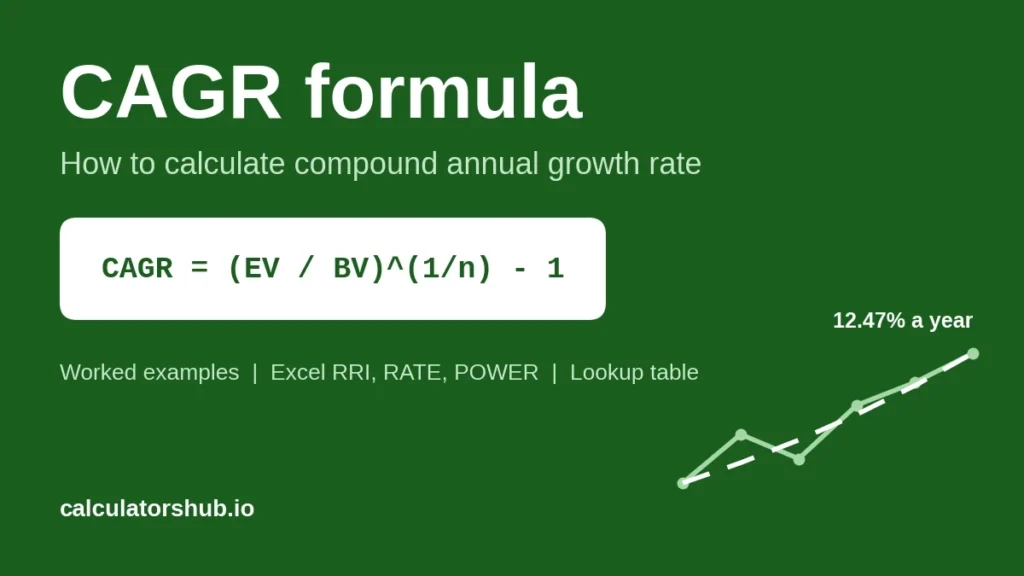
The CAGR formula is: CAGR = (ending value / beginning value)^(1 / number of years) – 1. If $10,000 grows to $18,000 over five years, the CAGR is 12.47%. That means the money grew as if it earned exactly 12.47% every single year, even if the real returns bounced around along the way.
Below you’ll find the formula broken down, a step-by-step example, four ways to get the same answer in Excel, and what to do when your dates don’t line up with whole years.
What is CAGR?
CAGR stands for compound annual growth rate. It’s the single yearly growth rate that would take a value from where it started to where it ended, assuming the growth compounded once a year.
Real growth is never that smooth. A stock might gain 30% one year and lose 15% the next. A company’s revenue might jump in year two and stall in year three. CAGR ignores that path and asks one question: what steady rate would have produced the same end result?
That’s why it’s the standard way to compare things that grew over different paths. Two funds can both end up turning $10,000 into $18,000 over five years, one with wild swings and one with calm steady gains. Their CAGR is identical: 12.47%. Whether that’s good news depends on how much volatility you’re willing to accept, which CAGR doesn’t tell you (more on that in the limitations section).
You’ll see CAGR used for investment returns, revenue growth, user growth, market size forecasts and salary history. Anything with a start value, an end value and a time period can have a CAGR.
What is the CAGR formula?
CAGR = (EV / BV)^(1 / n) - 1
EV is the ending value. BV is the beginning value. n is the number of years between them.
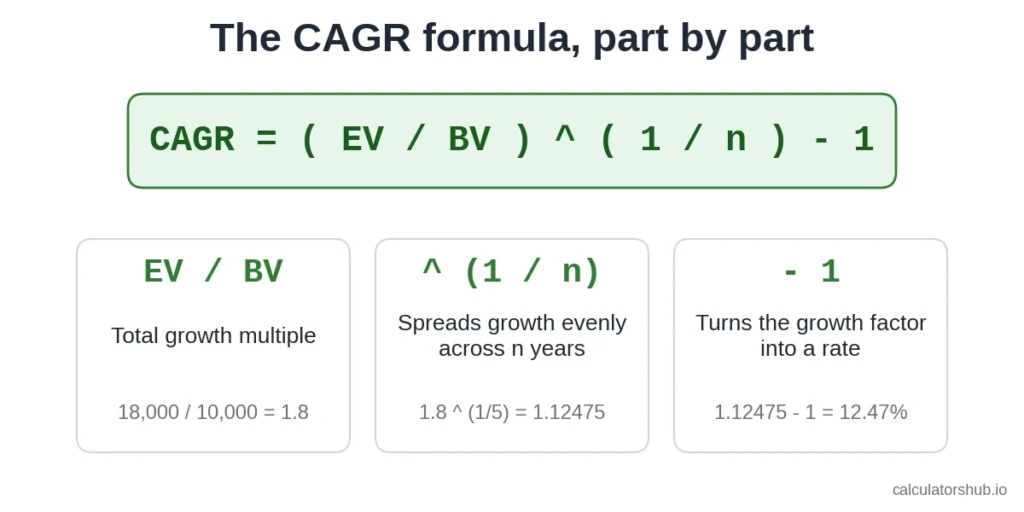
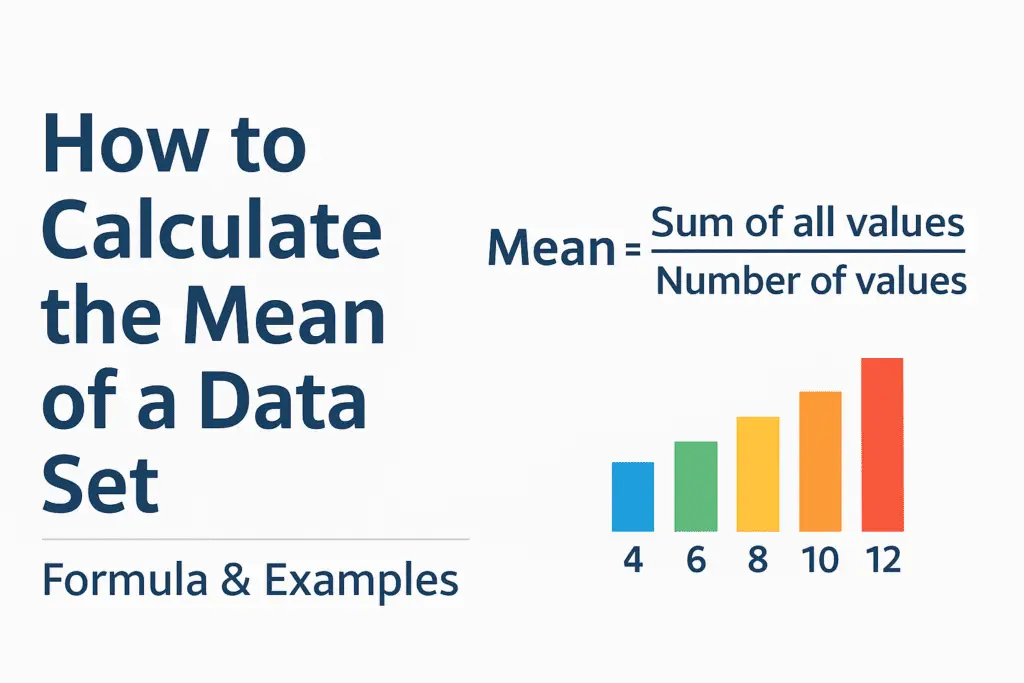
The formula works in three moves. EV / BV gives you the total growth multiple, so 1.8 means the value grew 80%. Raising that to the power of 1/n takes the nth root, which spreads the growth evenly across each year. Subtracting 1 turns the yearly growth factor into a rate you can read as a percentage.
A few details trip people up:
- n counts the gap between the first and last value, not the number of data points. If you have values for 2020, 2021, 2022, 2023, 2024 and 2025, that’s six values but five years of growth, so n = 5.
- The formula assumes yearly compounding. If you want a monthly growth rate instead, use months for n and you’ll get a monthly compound rate.
- BV has to be positive. If it’s zero or negative, the math breaks, and there’s a section on that below.
How do you calculate CAGR step by step?
Take the same example: an investment worth $10,000 at the start and $18,000 five years later.
- Divide the ending value by the beginning value. 18,000 / 10,000 = 1.8. The ratio is the same thing a percentage calculator gives you as 180% of the original.
- Raise the result to the power of 1 divided by the number of years. 1.8^(1/5) = 1.8^0.2 = 1.12475.
- Subtract 1. 1.12475 – 1 = 0.12475, or 12.47%.
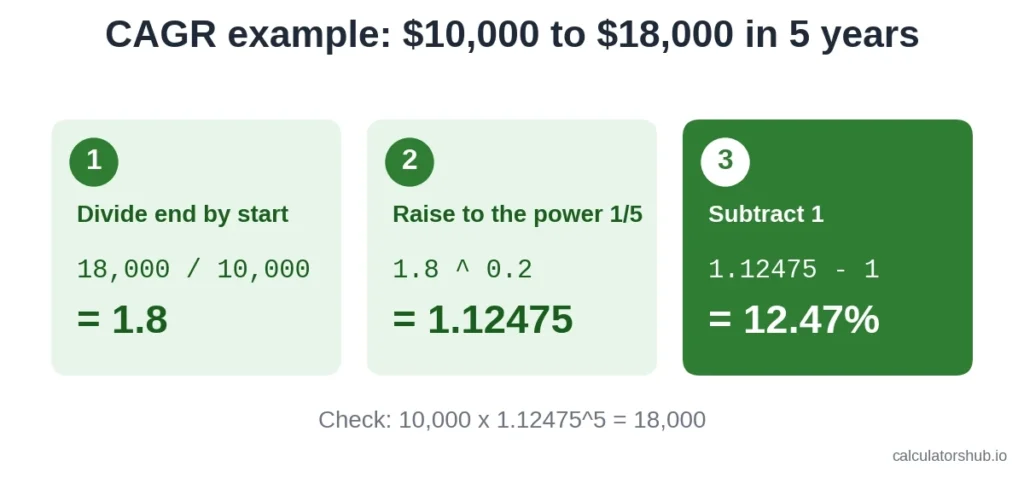
You can check the answer by running it forward. $10,000 × 1.12475 × 1.12475 × 1.12475 × 1.12475 × 1.12475 = $18,000. If your forward check doesn’t land on the ending value, something went wrong in step 2, and the usual culprit is typing ^1/5 instead of ^(1/5). Without the brackets, a calculator raises 1.8 to the first power and then divides by 5, which gives 0.36.
CAGR is also the geometric mean of the yearly growth factors minus 1. If you already have each year’s growth factor, a geometric mean calculator will get you to the same number.
How do you calculate CAGR in Excel and Google Sheets?
Put the beginning value in A2 and the ending value in B2. Each of these four formulas returns 12.47% for the example above:
| Method | Formula | Works in |
|---|---|---|
| Exponent operator | =(B2/A2)^(1/5)-1 | All Excel versions, Google Sheets |
| POWER function | =POWER(B2/A2,1/5)-1 | All Excel versions, Google Sheets |
| RRI function | =RRI(5,A2,B2) | Excel 2016 and later, Google Sheets |
| RATE function | =RATE(5,0,-A2,B2) | All Excel versions, Google Sheets |
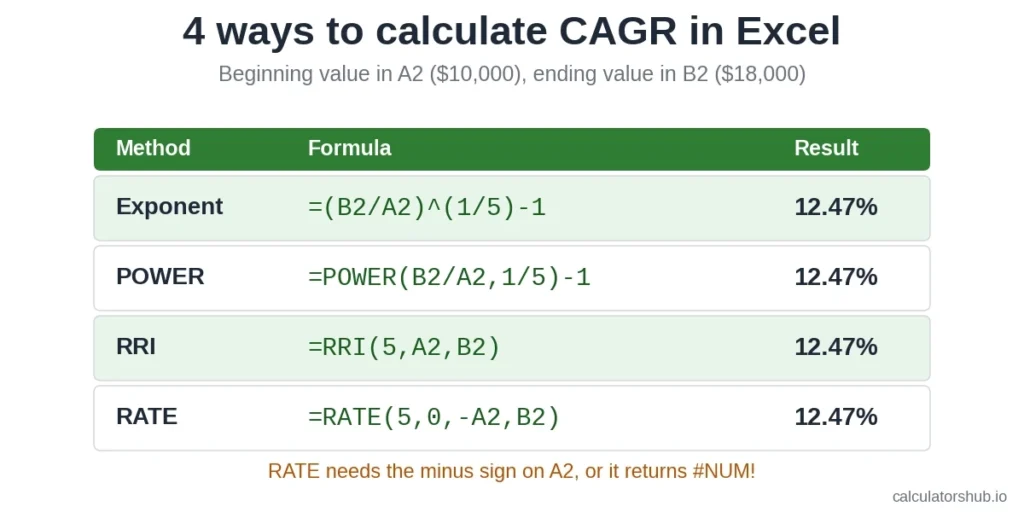
The first two are the formula written out directly. They work in every version of Excel and in Google Sheets.
RRI is the cleanest option. It was built for exactly this job and takes three arguments in this order: number of periods, present value, future value. Microsoft lists it as available in Excel 2016 and later, including Microsoft 365 (RRI function documentation). Google Sheets supports it too.
RATE is a loan and annuity function, but it solves CAGR when you set the payment argument to 0. The catch is the minus sign in front of A2. RATE treats money going out and money coming back as opposite signs, so if both values are positive you’ll get a #NUM! error. That minus sign is the most common reason people think RATE doesn’t work for CAGR.
Format the result cell as a percentage with two decimals, or Excel will show 0.12 and hide the precision.
If your years aren’t in a fixed number, replace the 5 with a cell reference such as C2, or calculate it from the years in your data: =(B2/A2)^(1/(2025-2020))-1.
How do you find CAGR for months or exact dates?
Investments rarely start on January 1 and end on December 31. If you round a partial period to the nearest whole year, the error can be bigger than you’d expect.
Say $5,000 was invested on March 15, 2021 and was worth $7,400 on September 30, 2025. That’s 1,660 days, or 4.55 years.
Using 4.55 years, the CAGR is 9.00%. Round down to 4 years and you get 10.30%. Round up to 5 and you get 8.16%. Same money, a two-point spread, purely from how you counted time.
In Excel, put the start date in C2 and end date in D2 and use:
=(B2/A2)^(1/YEARFRAC(C2,D2,3))-1
YEARFRAC turns the gap between two dates into a decimal number of years. The last argument matters. Basis 3 uses a 365-day year, which matches the 4.55 figure above. If you leave it blank, YEARFRAC defaults to a 30/360 day count, which gives a slightly different result (YEARFRAC function documentation). Pick one basis and use it every time you compare investments.
For a monthly compound rate instead of a yearly one, use the number of months as n. 54 months of growth from 5,000 to 7,400 gives a monthly rate of about 0.73%.
CAGR lookup table: how much growth per year?
This table answers the question in reverse: if something doubled or tripled, what yearly rate did that take? Every figure is the exact CAGR, calculated as the growth multiple to the power of 1/years, minus 1.
| Growth multiple | 3 years | 5 years | 10 years |
|---|---|---|---|
| 1.25x (25% total) | 7.72% | 4.56% | 2.26% |
| 1.5x (50% total) | 14.47% | 8.45% | 4.14% |
| 2x (doubled) | 25.99% | 14.87% | 7.18% |
| 3x (tripled) | 44.22% | 24.57% | 11.61% |
Two things stand out. Doubling in three years needs almost 26% a year, which is a very high sustained rate for most investments. And stretching the same growth over a longer period shrinks the CAGR faster than people expect: tripling over 10 years is only 11.61% a year.
Can CAGR be negative?
Yes. If the ending value is lower than the beginning value, the ratio is below 1 and the CAGR comes out negative.
An account that falls from $10,000 to $7,500 over four years has a CAGR of -6.94%. It lost the equivalent of 6.94% of its value each year, compounded.
What CAGR can’t handle is a beginning value of zero or below. Dividing by zero is undefined, and a negative ratio can’t be rooted to a real number when n is even. This comes up with businesses that went from a loss to a profit. A company whose net income moved from -$200,000 to $500,000 has no meaningful CAGR for net income. The usual fix is to measure CAGR on a line that stays positive, such as revenue, or to report the absolute change instead.
What’s the difference between CAGR and average annual growth rate?
Average annual growth rate (AAGR) adds up each year’s growth rate and divides by the number of years. CAGR compounds. When growth is uneven, the two can be far apart.
Take a value that moves 100, then 150, then 90, then 135 over three years. The yearly returns are +50%, -40% and +50%.
| Metric | Calculation | Result |
|---|---|---|
| AAGR | (50 – 40 + 50) / 3 | 20.00% |
| CAGR | (135 / 100)^(1/3) – 1 | 10.52% |
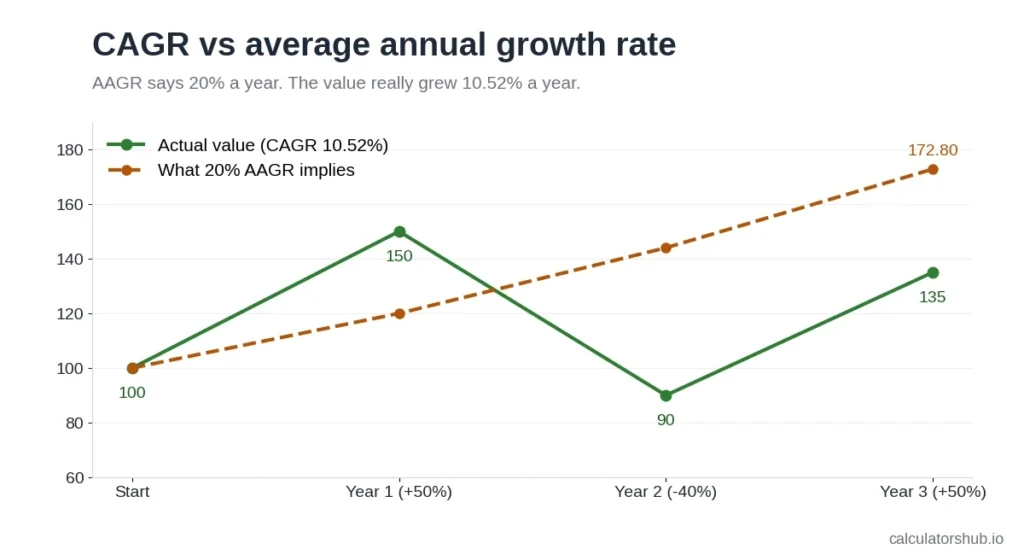
Only one of those describes what happened. If you started with 100 and grew 20% a year for three years, you’d have 172.80. The real ending value was 135. AAGR overstates growth because a 40% loss needs a 67% gain just to get back to even, and a simple average doesn’t account for that. CAGR does.
When someone quotes an “average return” without saying which kind, ask. The difference is widest for anything volatile.
CAGR vs ROI vs IRR: which one should you use?
These three answer different questions, and mixing them up is where a lot of bad comparisons come from.
ROI is total return over the whole period. For the $10,000 that became $18,000, ROI is 80%. It doesn’t care whether that took 2 years or 20. Our ROI calculator gives you this figure along with the gain in dollars.
A common mistake is dividing ROI by the number of years. 80% / 5 = 16% a year sounds reasonable, but it’s wrong for the same reason AAGR is wrong. It ignores compounding. The real annual rate is 12.47%.
CAGR is the compounded annual rate between two points. Use it when you have one starting value, one ending value and nothing added or withdrawn in between.
IRR (internal rate of return) handles cash flowing in and out during the period. If you invested $10,000, added $2,000 in year two and withdrew $1,000 in year four, CAGR can’t account for those moves. IRR can. In Excel that’s the IRR function for evenly spaced cash flows and XIRR for irregular dates.
A quick rule: one deposit and one ending value, use CAGR. Money moving in and out, use IRR. Total gain regardless of time, use ROI.
How do you use CAGR in reverse?
Rearrange the formula and CAGR answers planning questions, which is what people usually mean by a reverse CAGR calculation.
To find the rate you need, plug your target into the standard formula. You have $20,000 and want $50,000 in eight years: (50,000 / 20,000)^(1/8) – 1 = 12.14%. That’s the yearly return the plan requires, and you can judge for yourself whether it’s realistic.
To project a future value from a known rate:
FV = BV × (1 + CAGR)^n
$20,000 growing at 7% a year for 10 years becomes 20,000 × 1.07^10 = $39,343.03.
To find how many years it will take:
n = ln(EV / BV) / ln(1 + CAGR)
Getting from $10,000 to $25,000 at 8% a year takes ln(2.5) / ln(1.08) = 11.91 years. A log calculator handles the natural logs if you’re working by hand.
The same approach works for salary. If your pay went from $52,000 to $64,000 over four years, your salary CAGR is 5.33%. Compare that against inflation for the same period and you’ll know whether you actually got ahead.
What is a good CAGR?
There’s no single number, because a good CAGR depends on what you’re measuring and what else you could have done with the money.
For an investment, the fair test is against a benchmark with similar risk over the same dates. A 7% CAGR is weak for a small-cap stock fund in a strong market and excellent for a savings account. For a business, compare revenue CAGR against competitors or against the growth of the market itself. A company growing 8% a year in a market growing 15% is losing share.
The rule of 72 gives a fast sense of scale. Divide 72 by the CAGR and you get roughly how many years it takes to double. Here’s how close the shortcut gets to the exact answer:
| CAGR | Rule of 72 estimate | Exact doubling time |
|---|---|---|
| 6% | 12.00 years | 11.90 years |
| 8% | 9.00 years | 9.01 years |
| 10% | 7.20 years | 7.27 years |
| 12% | 6.00 years | 6.12 years |
Between 6% and 10%, the shortcut is off by less than a tenth of a year. It drifts further at very high or very low rates, so use the exact formula for anything you’re going to act on.
What are the limitations of CAGR?
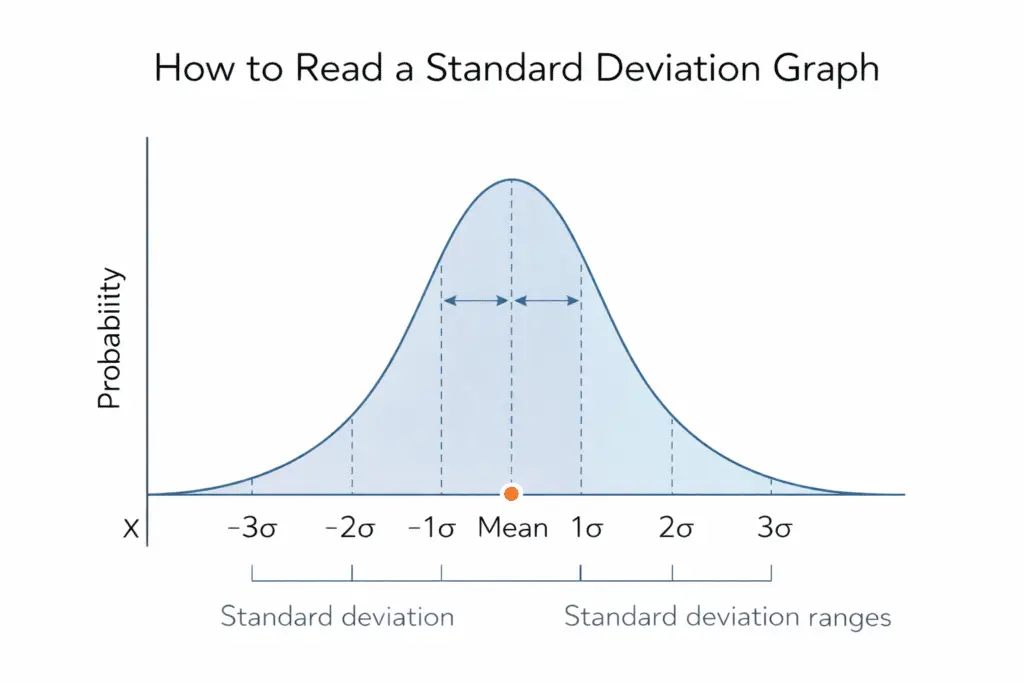
CAGR hides volatility. Two investments with the same CAGR can have very different rides, and a smooth 10% a year is not the same experience as +40%, -30%, +25%. If you want to see how bumpy the path was, calculate the standard deviation of the yearly returns with a standard deviation calculator. A higher number means more swings behind the same average.
It only looks at the endpoints. A fund that was up 60% in year four and crashed in year five shows the same CAGR as one that grew slowly the whole time, as long as the start and end values match. Change either endpoint by a few months and the CAGR can move a lot.
It can’t account for deposits or withdrawals. Any money added along the way inflates the ending value and makes the CAGR look better than the actual return.
Short periods mislead. A 50% gain over one year is a 50% CAGR, but that says very little about what the next five years will look like. CAGR is most useful over three years or more.
Frequently asked questions
What does a 5% CAGR mean?
It means the value grew as if it earned 5% every year, compounded. $1,000 at a 5% CAGR becomes $1,628.89 after 10 years. The actual yearly returns may have been higher in some years and lower in others.
What is a 3-year CAGR?
It’s the compound annual growth rate calculated over a three-year window. If revenue went from $200,000 to $260,000 over three years, the 3-year CAGR is (260,000 / 200,000)^(1/3) – 1 = 9.14%.
How do you calculate CAGR for 5 years?
Divide the year-5 value by the starting value, raise the result to the power of 0.2 (which is 1/5), and subtract 1. In Excel, =RRI(5,A2,B2) does the whole thing in one step.
How much CAGR do you need to double your money in 3 years?
25.99% a year. For five years it’s 14.87%, and for ten years it’s 7.18%.
Is CAGR the same as compound interest?
They use the same math in opposite directions. Compound interest starts with a rate and calculates the ending value. CAGR starts with the ending value and works out the rate. A savings account at a fixed 4% has a CAGR of 4% over any period, as long as no money is added or taken out.