If you’ve ever seen the equation y=mx+b, you’ve already encountered the slope intercept form of a linear equation.
This form is used constantly in algebra because it shows a linear relationship in a way you can read and graph directly. Slope intercept form gives you a clear way to write any straight line.
Why Is Slope-Intercept Form Important?
The slope intercept form equation:
- m the slope (how steep the line is)
- b the y-intercept (where the line crosses the y-axis)
Unlike other equation forms, you don’t need to rearrange anything. Everything you need to graph the line or understand its behavior is already visible.
That’s why students, teachers, and professionals prefer this format.
Where Is Slope Intercept Form Used?
Slope intercept form is used in:
- Algebra and geometry classes
- Standardized tests
- Graphing linear equations
- Economics and business modeling
- Physics (motion and rate problems)
- Data analysis and trend lines
Any situation that involves a constant rate of change can be modeled using y=mx+b.
Table of Contents
What Is Slope Intercept Form? (Definition + Meaning)

Slope Intercept Form Definition
The slope intercept form is a way of writing a linear equation so that the slope and y-intercept are clearly visible.
The standard slope intercept form equation is:
Where:
- m represents the slope of the line
- b represents the y-intercept
- x and y are variables
This form is called “slope-intercept” because it directly shows both the slope and the y-intercept of a straight line.
What Does y=mx+b Mean?
To fully understand slope intercept form, let’s break down y=mx+b piece by piece.
y: The Dependent Variable
This is the output value.
Its value depends on what x is.
x: The Independent Variable
This is the input value.
You can choose different x-values to generate points on the line.
m: The Slope
The slope tells you how steep the line is.
It represents the rate of change.
- If m is positive → the line goes upward
- If m is negative → the line goes downward
- If m is 0 → the line is horizontal
b: The Y-Intercept
The y-intercept is the point where the line crosses the y-axis.
It occurs when:
So in the equation:
- The slope (m) is 2
- The y-intercept (b) is 3
- The line crosses the y-axis at (0, 3)
Why This Form Is So Powerful
Unlike standard form (Ax + By = C), slope intercept form:
- Clearly shows the slope
- Clearly shows the y-intercept
- Makes graphing fast and simple
- Makes identifying rate of change easy
That’s why it’s one of the most commonly used linear equation formats in algebra
Understanding the Slope Formula

Before you can confidently write an equation in slope intercept form, you must understand one key concept: slope.
Slope tells you how steep a line is and how fast one variable changes compared to another.
What Is Slope?
Slope measures the rate of change between two points on a line.
In simple terms, slope answers this question:
How much does y change when x changes?
If y increases as x increases → the slope is positive.
If y decreases as x increases → the slope is negative.
If y does not change → the slope is zero (horizontal line).
The Slope Formula
When you are given two points, you use the slope formula to calculate the slope.
Where:
- (x1,y1) is the first point
- (x2,y2) is the second point
- m represents the slope
This formula is often remembered as:
Rise over Run
- Rise = change in y
- Run = change in x
The slope formula is a foundational concept in statistics, especially when analyzing trends and data sets. If you’re interested in delving deeper into how statistical methods, such as regression analysis, use formulas like slope to make predictions, consider checking out Coursera’s Basics of Statistical Analysis
Step-by-Step Example
Suppose you are given two points:
(2, 3) and (6, 11)
Step 1: Use the slope formula
Step 2: Subtract
Step 3: Simplify
So the slope is 2.
This means:
- For every 1 unit increase in x
- y increases by 2 units
Why the Slope Formula Matters
You need the slope formula because:
- It allows you to find m when given two points
- It helps you write equations in y = mx + b form
- It helps you graph linear equations correctly
Once you know the slope, you’re halfway to writing the full slope intercept form equation.
What Is the Y Intercept?

Now that you understand slope, let’s talk about the second key part of the slope intercept form equation:
The y-intercept is represented by b.
Y-Intercept Definition
The y-intercept is the point where a line crosses the y-axis.
This happens when:
In other words, the y-intercept is the value of y when x is zero.
How to Identify the Y-Intercept in an Equation
If the equation is already in slope intercept form:
Then the y-intercept is simply the number at the end (b).
Example 1:
- Slope (m) = 3
- Y-intercept (b) = 5
- The line crosses the y-axis at (0, 5)
Example 2:
- Slope (m) = -2
- Y-intercept (b) = -4
- The line crosses at (0, -4)
How to Find the Y-Intercept from a Graph
To find the y-intercept on a graph:
- Look at where the line crosses the y-axis
- Read the y-value at that point
- Write it as (0, b)
That point is your y-intercept. When calculating the slope and y-intercept of a line using a set of data points, it’s essential to check for outliers. Outliers can distort the results, affecting the accuracy of your model. To learn more about how to identify and handle outliers in your data.
How to Find the Y Intercept from a Table
If you’re given a table of values:
- Look for the row where x = 0
- The corresponding y-value is the y-intercept
Example:
| x | y |
|---|---|
| 0 | 7 |
| 1 | 9 |
| 2 | 11 |
Here, when x = 0, y = 7.
So the y-intercept is 7.
Why the Y-Intercept Is Important
The y-intercept tells you:
- The starting value of a relationship
- The initial amount before change begins
- Where to begin when graphing the line
In real-life situations, it often represents a starting value, such as:
- Starting cost
- Initial height
- Base salary
- Fixed fee
Now that you understand both m (slope) and b (y-intercept), you’re ready to learn how to combine them to find slope intercept form step by step.
How to Find Slope Intercept Form (Step-by-Step)

To write an equation in slope intercept form, your goal is always to get the equation into this format:
Where:
- m = slope
- b = y-intercept
Let’s go through the most common situations you’ll see.
Case 1: Given the Slope and Y-Intercept
If you’re given:
- Slope (m)
- Y-intercept (b)
Then writing the equation is simple.
Example:
Slope = 4
Y-intercept = −2
Step 1: Use the formula
Step 2: Substitute values
That’s it.
This is the easiest case.
Case 2: Given the Slope and One Point
If you’re given:
- The slope (m)
- A point (x, y)
You must solve for b.
Example:
Slope = 3
Point = (2, 11)
Step 1: Start with the formula
Step 2: Substitute m and the point values
Step 3: Solve
Step 4: Write final equation
Case 3: Given Two Points
If you’re given two points:
(1, 4) and (5, 12)
Step 1: Find the slope using the slope formula
Step 2: Use one point to find b
Start with:
Substitute slope and one point:
Step 3: Write final equation
Case 4: Given Standard Form (Ax + By = C)
Sometimes the equation isn’t in slope intercept form.
Example:
Your goal: Solve for y.
Step 1: Move x-term
Step 2: Divide everything by 3
Now it’s in slope intercept form.
- Slope = −2/3
- Y-intercept = 4
Quick Summary
To find slope intercept form:
- Identify what information you’re given
- Find the slope if necessary
- Plug into y=mx+b
- Solve for b if needed
- Write the final equation
These four cases cover the linear equation problems you will meet in an algebra course.
y=mx+b Examples (Solved Problems)
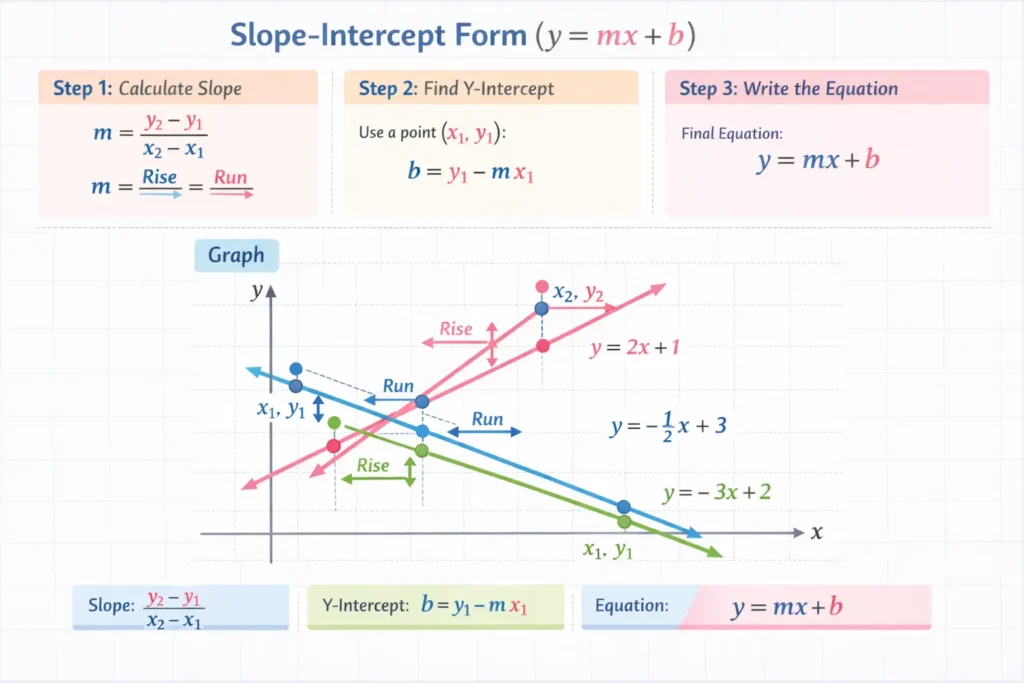
Now let’s apply everything you’ve learned with clear y=mx+b examples. These step-by-step problems will help you fully understand how to write and use the slope intercept form equation.
Example 1: Write the Equation from Slope and Intercept
Given:
- Slope (m) = 5
- Y-intercept (b) = −3
Step 1: Start with the slope intercept form equation
y=mx+b
Step 2: Substitute values
Final Answer:
Simple and direct.
Example 2: Find the Equation from a Graph Description
A line:
- Crosses the y-axis at 2
- Rises 3 units for every 1 unit to the right
This means:
- Slope (m) = 3
- Y-intercept (b) = 2
Write the equation:
Example 3: Find the Equation from One Point and Slope
Given:
- Slope = −2
- Point = (4, 1)
Step 1: Use y = mx + b
Step 2: Solve
Step 3: Write final equation
Example 4: Convert to Slope Intercept Form
Convert:
Step 1: Move x-term
Step 2: Divide by 2
Now it’s in slope intercept form.
Example 5: Real-World Example
A taxi charges:
- $4 starting fee
- $2 per mile
Let:
- x = miles
- y = total cost
Slope (m) = 2
Y-intercept (b) = 4
Equation:y=2x+4
This shows:
- The cost increases by $2 per mile
- The ride starts at $4
What These Examples Teach You
From these slope intercept form examples, you should notice:
- The structure always stays y=mx+b
- m controls the steepness
- b controls the starting point
- Real-life problems often represent rate + starting value
Once you spot this pattern, the rest is substitution.
How to Graph Slope Intercept Form

Graphing slope intercept form takes two points and a ruler.
Once your equation is in:
You already have everything you need.
Step 1: Plot the Y Intercept First
Remember:
- b is the y-intercept
- It is the point where x = 0
So if your equation is:
The y-intercept is 3.
Plot the point:
(0, 3)
Always start here.
After plotting the y-intercept and using the slope to find additional points, it’s important to understand how the data behaves around the line of best fit. A standard deviation graph can provide insight into the spread of data points.
Step 2: Use the Slope (m)
The slope tells you how to move from the y-intercept.
Slope is written as a fraction:
For example:
If m = 2, think of it as:
That means:
- Go up 2
- Go right 1
Plot that new point.
Step 3: Draw the Line
Once you have two points:
- The y-intercept
- One more point using slope
Draw a straight line through them.
Extend the line in both directions.
Done.
Example: Graph y = -1/2x + 4
Step 1: Plot the y-intercept
b = 4
Plot:
(0, 4)
Step 2: Use the slope
m = −1/2
This means:
- Go down 1
- Go right 2
Plot:
(2, 3)
You can repeat the pattern:
- (4, 2)
- (6, 1)
Step 3: Draw the line
Connect the points.
You now have the full graph.
Quick Graphing Tips
- Always start with the y-intercept
- Treat whole numbers as fractions over 1
- Negative slope means the line goes downward
- Positive slope means the line goes upward
- Zero slope means horizontal line
Common Graphing Mistakes
- Plotting the slope first
- Forgetting negative signs
- Flipping rise and run
- Not extending the line
Avoid these and your graph will be correct almost every time.
Using a Slope Intercept Form Calculator (When and Why)
Let’s be honest.
Manual calculations are great for learning.
But sometimes you just need a fast, accurate answer.
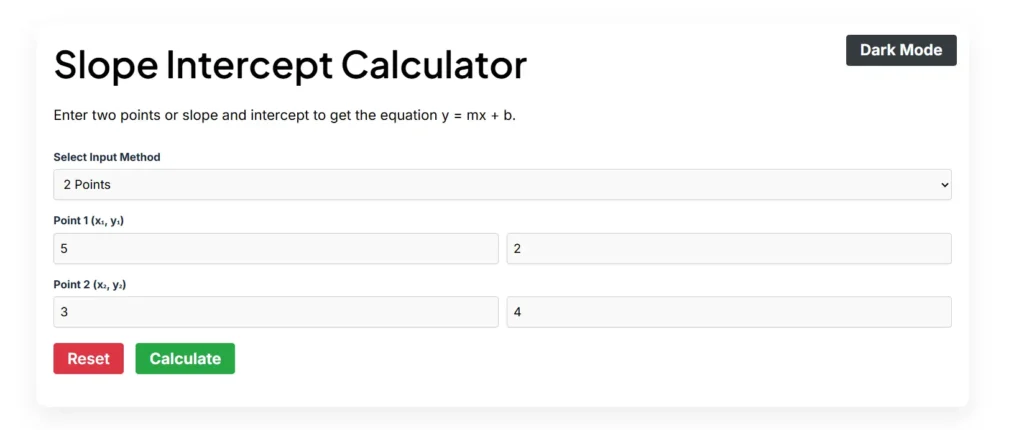
That’s where a slope intercept form calculator helps.
When Should You Use a Slope Calculator?
A slope intercept form calculator is useful when:
- You are working with large numbers
- You are checking homework answers
- You need quick verification before an exam
- You are solving multiple problems
- You want to avoid small arithmetic mistakes
It removes the arithmetic slips that cost marks.
Should You Always Use slope intercept form calculator?
Not at first.
If you’re learning slope intercept form, solve problems manually.
You need to understand the logic.
But once you understand:
- What slope means
- How to find it
- How to write y=mx+b
Then a calculator becomes a productivity tool.
Pro Tip for Students
Use a slope calculator to:
- Double-check answers
- Catch subtraction errors
- Confirm signs are correct
Sign mistakes are easy to make and hard to spot once the line is drawn.
Common Mistakes Students Make with Slope-Intercept Form

Even students who understand the basics still lose marks.
Not because the math is hard.
But because small mistakes sneak in.
Let’s fix that.
1. Mixing Up the Slope Formula
The correct slope formula is:
A common mistake?
Switching the order for x but not for y.
If you subtract in one direction on top, you must subtract in the same direction on bottom.
Wrong:
That changes the sign.
2. Forgetting Negative Signs
This is huge.
Example:
If you forget the negative sign, the graph changes completely.
The line goes up instead of down.
Always double-check signs when:
- Subtracting
- Dividing
- Moving terms
3. Confusing b with x-Intercept
In slope intercept form:y=mx+b
- b is the y-intercept, not the x-intercept.
- It is where the line crosses the y-axis.
Students often mix these up on graphs.
4. Not Solving Fully for y
If the equation is:
Some students stop at:
That is not slope intercept form yet.
You must divide everything by 2:
Now it’s correct.
5. Writing the Equation in the Wrong Format
Slope intercept form must look exactly like:
Not:
- mx + y = b
- y – mx = b
- Ax + By = C
Those are different forms.
6. Plotting the Slope Before the Y Intercept
When graphing slope intercept form:
Always plot b first.
Then use slope.
Reversing the order causes incorrect graphs.
7. Treating Whole Number Slopes Incorrectly
If slope is 4, it actually means:
Rise 4, run 1.
Students sometimes forget the run.
Every slope has both rise and run.
Quick Self-Check Before You Move On
Ask yourself:
- Did I use the correct slope formula?
- Did I solve completely for y?
- Is the equation written as y = mx + b?
- Did I check signs carefully?
- Did I plot the y-intercept first when graphing?
If yes, you’re solid.
Frequently Asked Questions (FAQs)
-
What is slope intercept form?
Slope intercept form is a way of writing the equation of a line:
Where:
m = slope (rate of change)
b = y-intercept (where the line crosses the y-axis)
It makes graphing and understanding linear relationships simple. -
How to find slope intercept form?
To find slope intercept form:
Identify the slope (m)
Identify the y-intercept (b)
Plug values into
Examples:
Slope = 3, y-intercept = 2 →
Slope = −1/2, y-intercept = 5 → -
How to graph slope intercept form?
Plot the y-intercept (b) on the y-axis
Use the slope (m) to find a second point
m = rise/run → move vertically and horizontally
Draw a straight line through the points -
How to write an equation in slope intercept form?
To write an equation in slope-intercept form, use the formula:
m is the slope (rate of change).
b is the y-intercept (where the line crosses the y-axis).
Steps:
Identify the slope (m).
Find the y-intercept (b).
Substitute these values into the formula. -
How to convert standard form to slope intercept form?
To convert an equation from standard form (Ax + By = C) to slope-intercept form (y=mx+b), follow these steps:
Start with the standard form equation:
Ax + By = C
Isolate y on one side of the equation. Subtract Ax from both sides:
By = -Ax + C
Solve for y by dividing each term by B:
y = (-A/B)x + C/B
Result: The equation is now in slope-intercept form y = mx + b, where:
m = -A/B (the slope)
b = C/B (the y-intercept) -
How to find slope intercept form with two points?
To find the slope-intercept form of a line (y = mx + b) from two points, follow these steps:
Identify the two points: Let the points be (x₁, y₁) and (x₂, y₂).
Calculate the slope (m): Use the slope formula:
Use one of the points and the slope to find the y-intercept (b):
Plug the slope (m) and one of the points into the equation y = mx + b. Solve for b:
Write the equation: Now you have the slope (m) and y-intercept (b), so you can write the equation in slope-intercept form:
y = mx + b