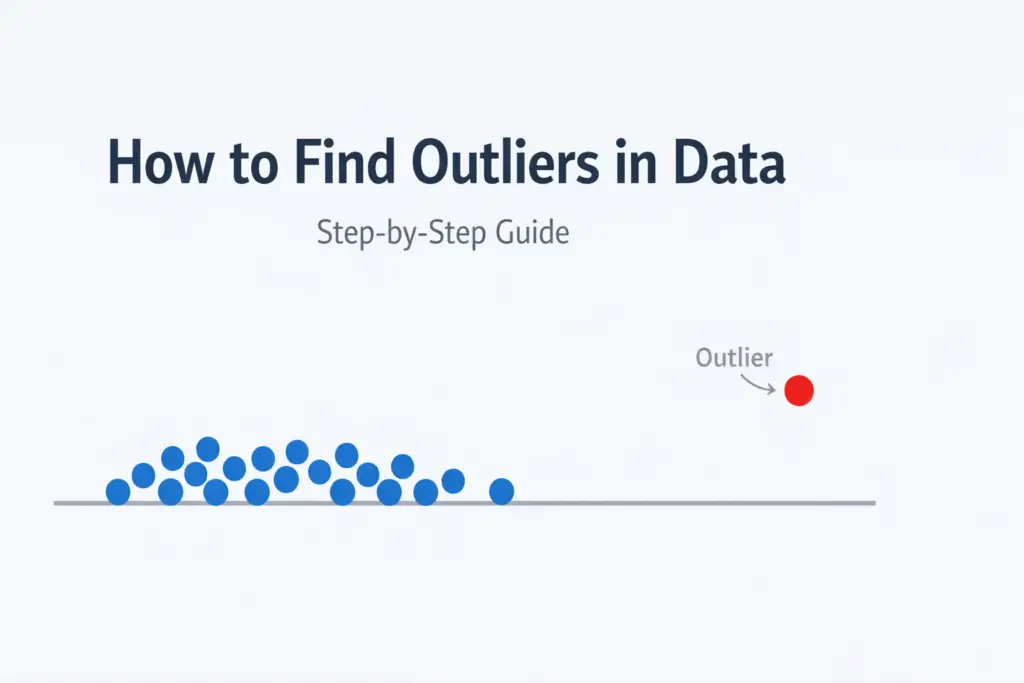
Outliers are values in a data set that are very different from the rest.
They can be unusually high or unusually low. Sometimes they are mistakes. Other times, they carry important meaning.
If you ignore outliers, your results can become misleading. A single extreme value can change the mean, affect graphs, and distort conclusions.
This is why understanding what is an outlier and how to find outliers correctly is important in math, statistics, and data analysis.
The 1.5 IQR rule is the standard method, and it works on any data set you can sort.
Table of Contents
What Is an Outlier?
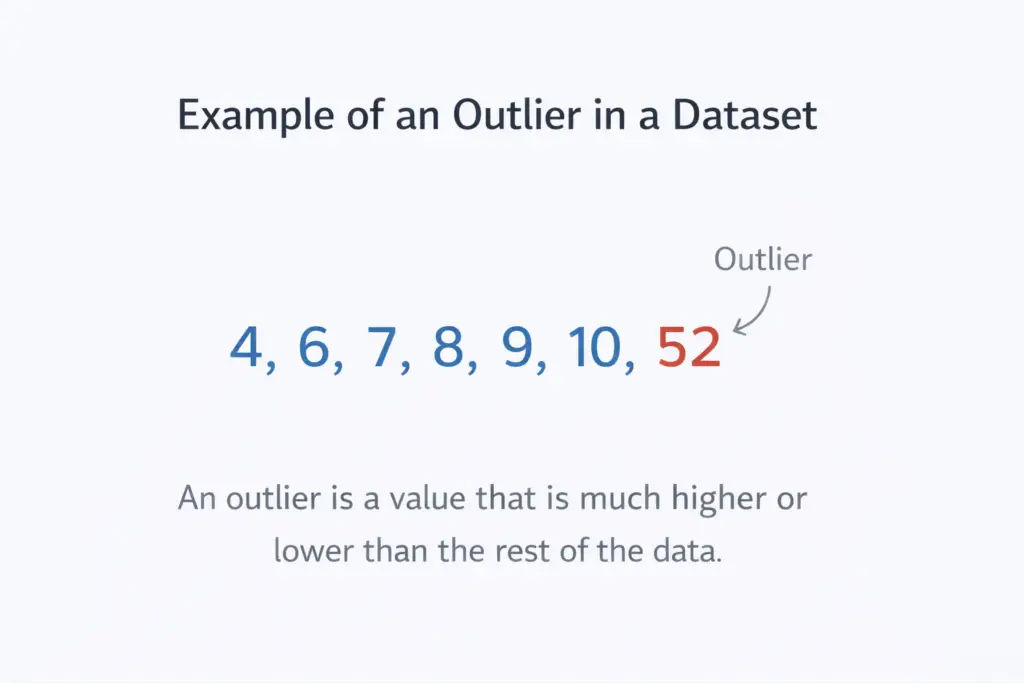
An outlier is a value in a data set that is much higher or much lower than the rest of the values.
In simple terms, it is a number that does not fit the overall pattern of the data.
Outlier Definition
The outlier definition in statistics is a data point that lies an abnormal distance from other observations.
This distance can be measured using formulas or seen visually in graphs.
What Is an Outlier in Math?
In math, an outlier is a value that stands apart from the main group of numbers.
For example, consider this data set:
Here, 52 is an outlier. All other values are close together, but 52 is far away from the rest.
This is a basic example of outlier math.
Why a Value Becomes an Outlier
A value may be an outlier for several reasons:
- A data entry error
- A measurement mistake
- A rare but valid observation
- A natural extreme in the data
Not all outliers are wrong. Some outliers contain useful information and should not be removed.
Define Outlier in a Data Set
To define outlier in a data set, ask this question:
Does this value behave very differently from the others?
If the answer is yes, it may be an outlier and should be examined carefully using proper methods.
Why Do Outliers Matter in Data Analysis?
One outlier can move the mean, widen the spread, and change the conclusion you draw.
Even a single extreme value can change the outcome of an analysis.
Outliers Can Distort Averages
Outliers have a strong impact on the mean.
For example, one unusually large value can pull the average upward. This can make the data appear higher or lower than it really is.
Outliers Affect Graphs and Visual Trends
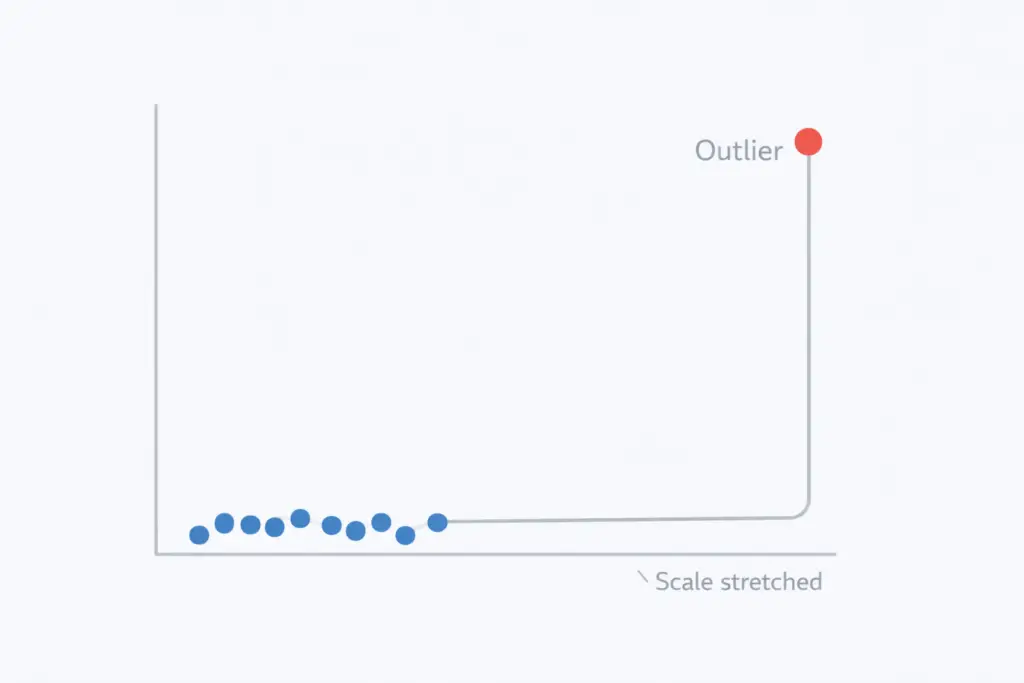
When outliers appear in charts or graphs, they can stretch the scale.
This makes normal data points look clustered together and harder to read. Patterns and trends may become unclear.
Outliers Influence Statistical Results
Outliers can change:
- Mean and standard deviation
- Correlation values
- Regression lines
If outliers are not handled correctly, statistical tests may give inaccurate results.
When Outliers Should Not Be Removed
Not all outliers are errors.
Some outliers represent real and meaningful events. For example:
- Extremely high sales during a promotion
- Unusual weather measurements
- Rare medical test results
Deleting these values without checking them first can hide the exact events you are trying to measure.
Why Identifying Outliers Is Essential
Knowing how to find outliers helps you:
- Detect errors in data
- Improve accuracy
- Make better decisions
Check an outlier before you delete it. It often points to something worth knowing.
How to Find Outliers in a Data Set (Overview of Methods)
There is more than one way to find outliers in data.
The right method depends on the size of the data set, the type of data, and how precise your analysis needs to be.
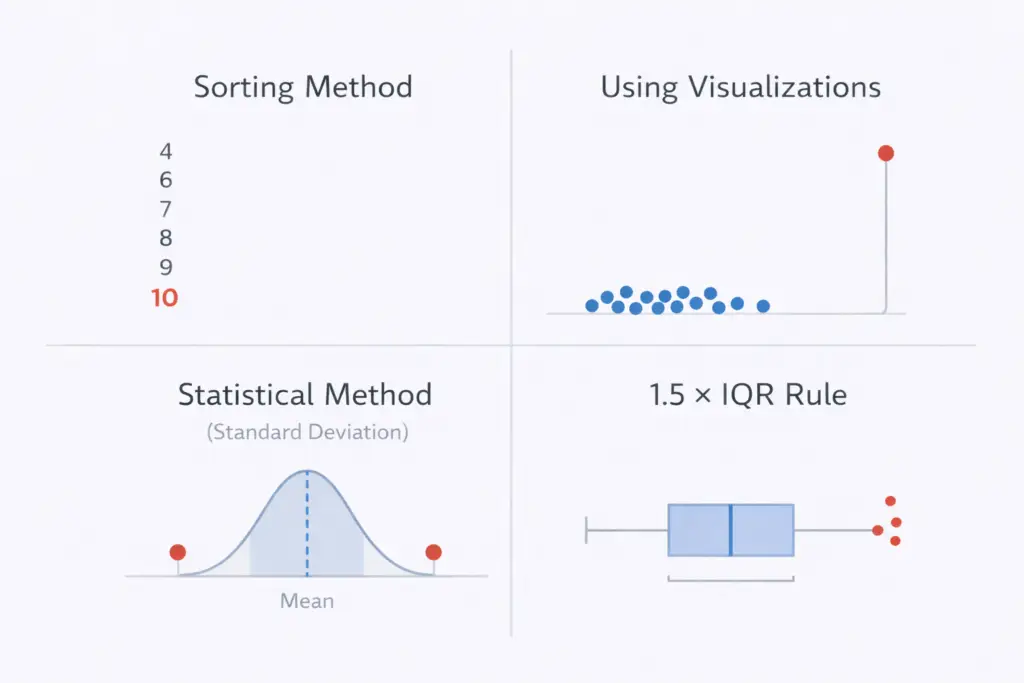
Below are the four most common ways of calculating outliers.
1. Sorting and Visual Inspection
This is the simplest method.
You sort the data from smallest to largest and look for values that are far away from the rest.
This method works best for small data sets. It helps you quickly spot obvious outliers but does not rely on any outlier formula.
2. Using Graphs and Visualizations
Visual tools make outliers easier to see.
Common options include:
In these graphs, outliers usually appear as points far from the main cluster.
This method is useful for understanding patterns but should be combined with statistical methods for accuracy.
3. Statistical Outlier Detection Using Formulas
This approach uses math to identify outliers.
It often involves:
- Mean and standard deviation
- Z score concepts
Values that fall far outside the normal range are considered outliers.
This method is common in statistics but can be sensitive to extreme values.
4. Using the Interquartile Range (1.5 IQR Rule)
The most reliable method is the 1.5 IQR rule.
It uses quartiles instead of the mean, which makes it less affected by extreme values.
This method is widely used in statistics and data analysis and works well for most data sets.
Below, you can learn how to find outliers with IQR step by step.
How to Find Outliers Using the 1.5 IQR Rule (Step by Step)
The 1.5 IQR rule is one of the most accurate and widely used methods to find outliers.
It works well because it is not affected by extreme values like the mean based methods.
What Is the 1.5 IQR Rule?
IQR stands for interquartile range.
It measures the spread of the middle 50 percent of the data.
The rule states that:
- Values below Q1 − 1.5 × IQR are outliers
- Values above Q3 + 1.5 × IQR are outliers
This is the standard outlier formula used in statistics.
Step 1: Sort the Data
Arrange all values in ascending order from smallest to largest.
This makes it easier to identify quartiles correctly.
Step 2: Find the First Quartile (Q1)
Q1 is the median of the lower half of the data.
It represents the 25th percentile.
Step 3: Find the Third Quartile (Q3)
Q3 is the median of the upper half of the data.
It represents the 75th percentile.
Step 4: Calculate the Interquartile Range (IQR)
Use this IQR formula:
This value shows how spread out the middle portion of the data is.
Step 5: Apply the Outlier Formula
Calculate the lower and upper limits.
Lower limit:
Q1 − 1.5 × IQR
Upper limit:
Q3 + 1.5 × IQR
Any value outside this range is an outlier.
Step 6: Identify the Outliers
Compare each data point with the calculated limits.
If a value is smaller than the lower limit or larger than the upper limit, it is an outlier.
This is how to find outliers with IQR accurately.
How to Find Outliers Using Standard Deviation
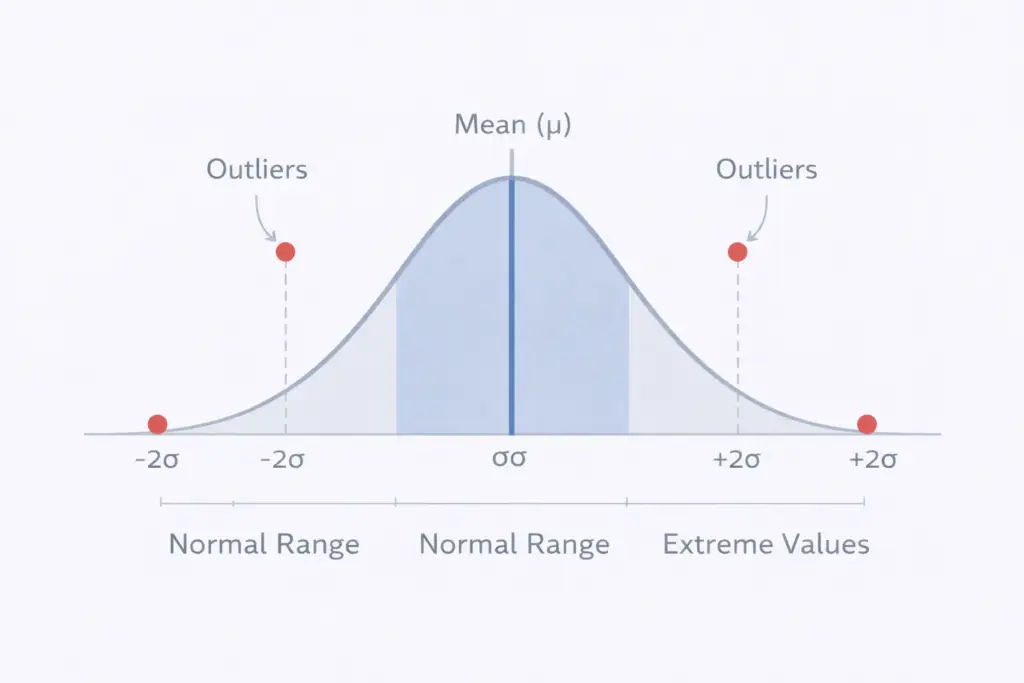
Another common way to find outliers is by using the mean and standard deviation.
This method works best when the data is roughly symmetric and does not contain many extreme values.
How This Method Works
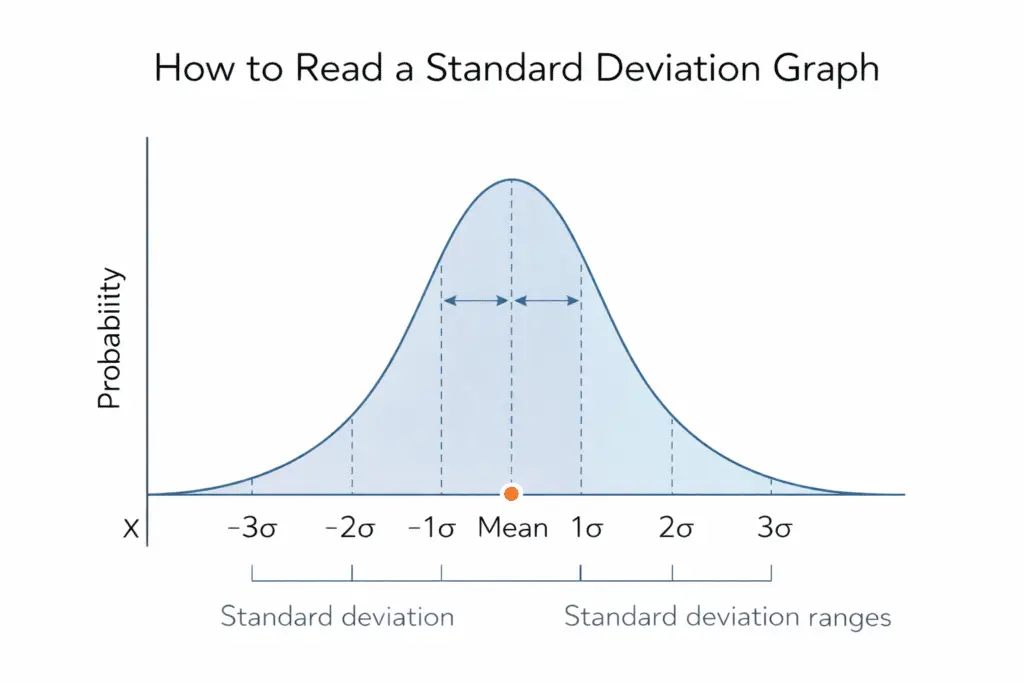
Standard deviation measures how far values are from the mean.
Values that are much farther away than normal may be outliers.
A common rule is:
- Values more than 2 or 3 standard deviations from the mean are considered outliers
Step 1: Calculate the Mean
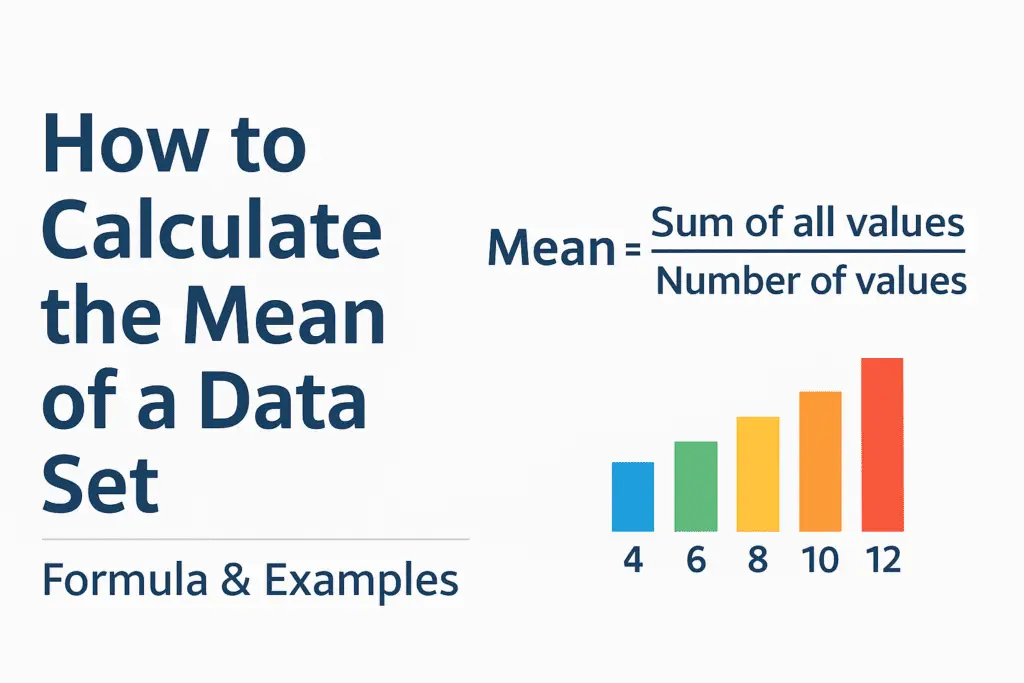
To calculate mean add all values in the data set and divide by the total number of values.
This gives you the average.
Step 2: Calculate the Standard Deviation
Find how much each value differs from the mean.
Then calculate standard deviation using the standard formula.
Step 3: Set the Outlier Limits
Use this rule:
Lower limit:
Mean − (k × standard deviation)
Upper limit:
Mean + (k × standard deviation)
Most often, k equals 2 or 3.
Step 4: Identify Outliers
Any value outside these limits is considered an outlier.
This method helps explain how to calculate outliers using statistical formulas.
When This Method Works Best
- Data follows a normal pattern
- There are few extreme values
- Mean and standard deviation are reliable
If data is heavily skewed, the 1.5 IQR rule is usually a better choice.
How to Find Outliers in Excel
Excel provides several ways to find outliers without complex calculations.
This method is useful for real world data analysis and quick checks.
Method 1: Find Outliers Using Quartile Formulas
This approach follows the 1.5 IQR rule directly in Excel.
Step by step:
- Enter your data in a single column
- Use the
QUARTILEorPERCENTILEfunction to find Q1 and Q3 - Calculate IQR as Q3 − Q1
- Compute lower and upper limits
- Compare values to identify outliers
This method follows the same formula you would use by hand.
Method 2: Use Conditional Formatting
Conditional formatting helps visually highlight outliers.
Steps:
- Select your data range
- Go to Conditional Formatting
- Choose rules based on values
- Highlight values far from the average
This method is quick but should be used with care.
Method 3: Find Outliers Using Excel Charts
Charts help you spot unusual values visually.
Best chart types:
- Box plots
- Scatter plots
Outliers appear as points far from the main data cluster.
When Excel Is a Good Choice
- Medium sized data sets
- Business or academic analysis
- When formulas and visuals are both needed
This section answers how to find outliers in Excel clearly and practically.
Using an Online Outlier Calculator
An online outlier calculator is the fastest way to detect outliers when you are working with large or repeated data sets.
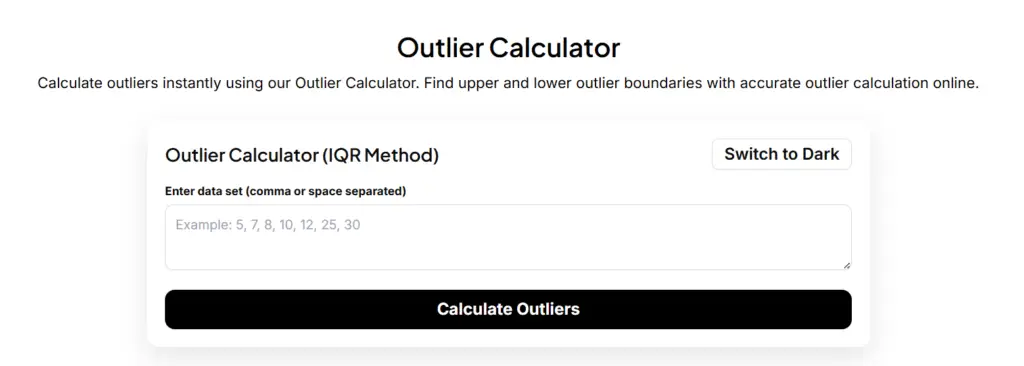
It removes manual calculations and reduces the chance of errors.
When an Outlier Calculator Is Useful
Using a calculator makes sense when:
- The data set is large
- You need quick results
- Manual calculation is time consuming
This option is popular among students, teachers, and analysts.
How to Use an Outlier Calculator Step by Step
Most online tools follow the same process.
- Enter your data values
- Choose the method, usually the 1.5 IQR rule
- Click calculate
- Review the identified outliers
Above Outlier calculator also show intermediate values like Q1, Q3, and IQR.
How to Interpret the Results
A calculator highlights values that fall outside the allowed range.
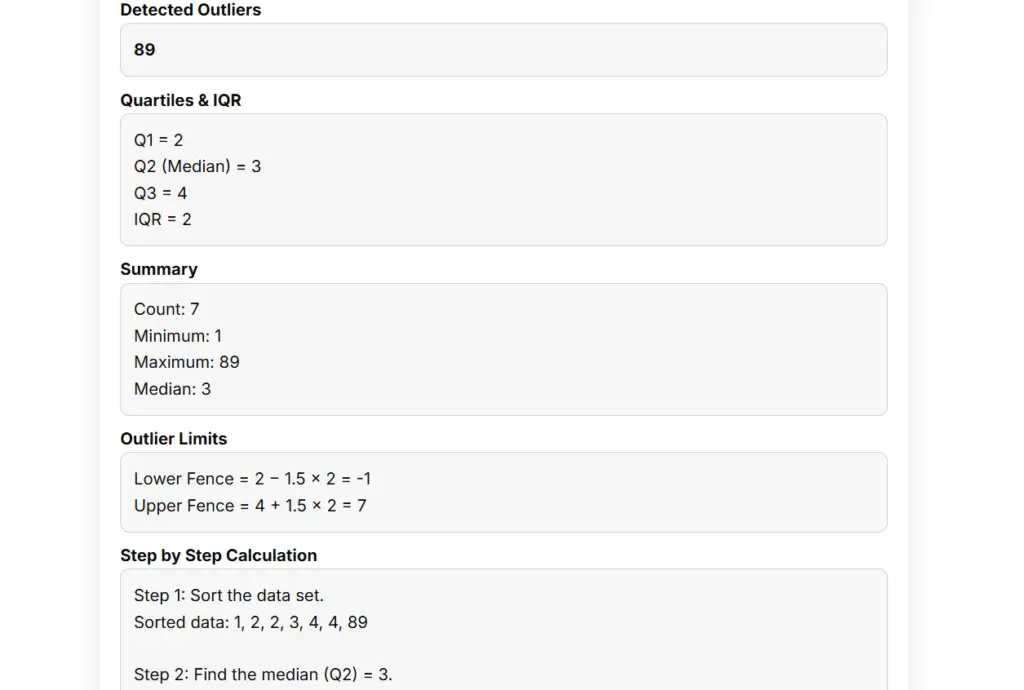
These values are potential outliers, not automatic errors.
Always review them in context before removing anything.
Why Understanding the Method Still Matters
Even with a calculator, you should understand:
- What the outlier formula is doing
- Why a value is flagged
- Whether the outlier is meaningful
Calculators work best when paired with proper understanding.
Which Outlier Method Should You Use?
There is no single method that works best in every situation.
The right choice depends on your data type, size, and goal.
Use the Sorting Method for Small Data Sets
If your data set is small, sorting and visual inspection can be enough.
This method helps you quickly spot extreme values, but it does not use any outlier formula.
Best for:
- Small lists
- Quick checks
- Simple datasets
Use Visualizations to Spot Patterns
Graphs are useful when you want to understand the overall data shape.
Box plots and scatter plots show outliers clearly.
Best for:
- Exploratory analysis
- Presentations
- Identifying trends visually
Use the 1.5 IQR Rule for Most Data Sets
The 1.5 IQR rule is the most reliable choice in most cases.
It works well even when data is skewed and is not affected much by extreme values.
Best for:
- Real world data
- Skewed distributions
- Statistical analysis
Use Standard Deviation for Symmetric Data
Mean and standard deviation methods work best when data follows a normal pattern.
If the data is skewed, this method may misclassify values as outliers.
Best for:
- Normally distributed data
- Academic problems
- Clean data sets
Use Excel or Calculators to Save Time
Excel and online calculators help when:
- Data sets are large
- Repeated analysis is needed
- Accuracy and speed matter
Always understand the method before trusting the output.
10. Common Mistakes When Finding Outliers
Finding outliers sounds simple. In practice the errors come from the same few places. Here are the most common mistakes and how to avoid them.
Treating every extreme value as an error
Not all outliers are mistakes. Some are real and important. For example, very high income values matter in financial data. Always check context before removing anything.
Using only one method
Relying on a single technique can mislead you. IQR, Z-score, and visual methods often give different results. Cross-check when the data matters.
Ignoring data distribution
Many methods assume normal distribution. If your data is skewed, Z-scores can fail. In that case, IQR usually works better.
Removing outliers without explanation
Deleting values just to make results look clean is risky. Always document why you removed them. Otherwise, results lose credibility.
Forgetting sample size
Small datasets exaggerate outliers. One unusual value can shift the mean a lot. Be extra careful with limited data.
Using mean instead of median
The mean is sensitive to outliers. When outliers exist, median and IQR often describe the data better.
Not visualizing the data
Numbers alone hide patterns. A box plot or scatter plot shows the shape that a formula alone will not.
Over-cleaning the data
Removing too many points can distort reality. Sometimes outliers tell the real story.
If you want to avoid these mistakes, using an automated tool helps. An outlier calculator applies standard rules consistently and shows results clearly, without guesswork.
11. Real Example: Finding Outliers Step by Step
Let’s walk through a simple, real example. This makes everything clearer.
Dataset:
Test scores of 10 students
45, 48, 50, 52, 53, 55, 56, 58, 60, 95
At first glance, 95 already looks suspicious. But we will confirm it properly.
Step 1: Sort the data
The data is already sorted from smallest to largest. This step is always required.
Step 2: Find the median
There are 10 values, so the median is the average of the 5th and 6th values.
Step 3: Split the data into two halves
Lower half:
45, 48, 50, 52, 53
Upper half:
55, 56, 58, 60, 95
Step 4: Find Q1 and Q3
Q1 is the median of the lower half: 50
Q3 is the median of the upper half: 58
Step 5: Calculate the IQR
IQR = Q3 − Q1
IQR = 58 − 50 = 8
Step 6: Calculate outlier limits
Lower bound:
Q1 − (1.5 × IQR) = 50 − 12 = 38
Upper bound:
Q3 + (1.5 × IQR) = 58 + 12 = 70
Step 7: Identify outliers
Any value below 38 or above 70 is an outlier.
In this dataset, 95 is above 70.
So, 95 is an outlier.
What this example shows
The number looked unusual, but the IQR method confirmed it mathematically. This is why structured methods matter more than guessing.
Frequently Asked Questions (FAQs)
What are outliers?
Outliers are values in a dataset that are much higher or lower than the rest of the data.
They stand out because they do not follow the overall pattern.
In math and statistics, an outlier can strongly affect averages, graphs, and conclusions.
That is why identifying them is important before analysis.
How to find outliers in a data set?
You can find outliers using several methods:
1, Sorting the data and checking extreme values
2, Visual tools like box plots or scatter plots
3, Statistical methods such as standard deviation
4, The IQR method, which is the most commonly used
For most datasets, the IQR method gives the most reliable results.
How to find outliers with IQR?
Here are the basic steps:
1, Sort the dataset
2, Find Q1 (first quartile) and Q3 (third quartile)
3, Calculate IQR = Q3 − Q1
4, Multiply IQR by 1.5
5, Calculate lower and upper bounds
6, Any value outside those bounds is an outlier
This method works well even when the data is not normally distributed.
What is the 1.5 IQR rule?
The 1.5 IQR rule is a standard statistical rule used to detect outliers.
A value is an outlier if:
It is less than Q1 − (1.5 × IQR), or
It is greater than Q3 + (1.5 × IQR)
This rule is widely used in box plots and data analysis because it is simple and reliable.