Degrees of freedom appear in almost every statistics formula. You see them in t tests, chi square tests, ANOVA tables, and even Excel outputs.
It is easy to calculate df from a formula without knowing what it represents. That leads to the wrong critical value and the wrong p value.
Degrees of freedom count how many values in a calculation are free to vary once the constraints are set.
Table of Contents
What Is DF in Statistics?
In statistics, DF stands for degrees of freedom. It describes how many values in a calculation are free to change while still following a set of rules or constraints.
In simple terms, degrees of freedom tell you how much flexibility your data has.
When you work with a data set, not every value can vary independently. Once certain values are fixed, the remaining values lose freedom. The number of values that can still change is called degrees of freedom.
You need this number for t tests, chi square tests and ANOVA.
Why Degrees of Freedom Exist
Degrees of freedom exist because statistical calculations often include constraints.
For example, if you know the average of a data set and all values except one, the last value is already determined. It cannot change freely anymore.
That limitation reduces the degrees of freedom.
Simple Example
Imagine you have three numbers that must add up to 30.
If the first two numbers are 10 and 15, the third number must be 5. It has no freedom to change.
In this case:
- Total values = 3
- Constraints = 1
- Degrees of freedom = 2
This is why degrees of freedom are often related to sample size but are not always equal to it.
What Is DF in Statistics Used For?
Degrees of freedom are used to:
- Select the correct statistical distribution
- Find critical values in tables
- Calculate accurate p values
- Ensure test results are valid
Without the correct df value, statistical conclusions can be misleading.
Why Degrees of Freedom Matter
Degrees of freedom change how a test behaves and how you read the result. They directly affect how statistical tests behave and how results are interpreted.
If degrees of freedom are wrong, the final conclusion can also be wrong.
Degrees of Freedom Control Accuracy
Statistical tests compare your data against a reference distribution. The shape of that distribution depends on degrees of freedom.
Lower df values create wider distributions. Higher df values create narrower and more precise distributions.
This means df influences:
- Critical values
- Confidence intervals
- P values
Even small changes in df can shift test results.
Degrees of Freedom Affect Hypothesis Testing
In hypothesis testing, degrees of freedom determine how strict or lenient the test is.
With fewer degrees of freedom:
- Results are more conservative
- Larger differences are needed to show significance
With more degrees of freedom:
- Tests become more sensitive
- Smaller differences may appear significant
Why You Cannot Ignore DF in Statistics
Some people focus only on formulas and calculators. That is risky.
Degrees of freedom act as a reality check. They ensure that statistical models do not overestimate certainty when data is limited.
Understanding degrees of freedom helps you:
- Choose the correct test
- Avoid false positives
- Interpret results with confidence
Once you know why df matters, the next step is learning the actual degrees of freedom formula and how it works in practice.
Degrees of Freedom Formula
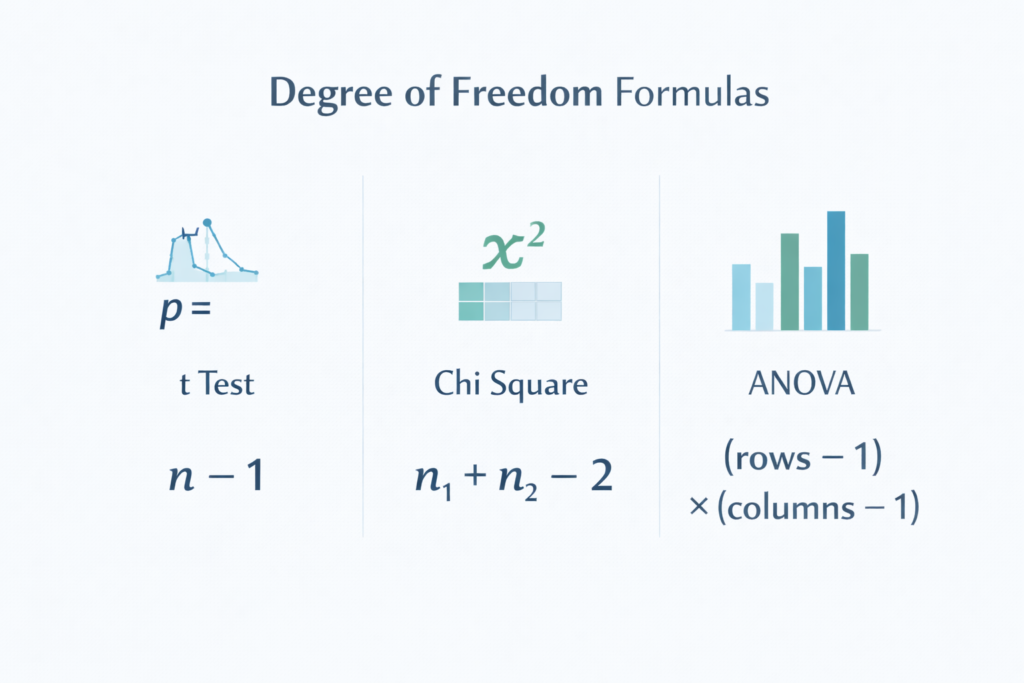
The degrees of freedom formula depends on the type of statistical test you are using. However, most df calculations follow one basic idea.
General Degrees of Freedom Formula
In many cases, degrees of freedom are calculated using this simple formula:
This formula explains why df is often smaller than the total sample size.
What Does This Formula Mean?
- Number of observations refers to the total values in your data set
- Number of constraints refers to rules that limit how values can vary
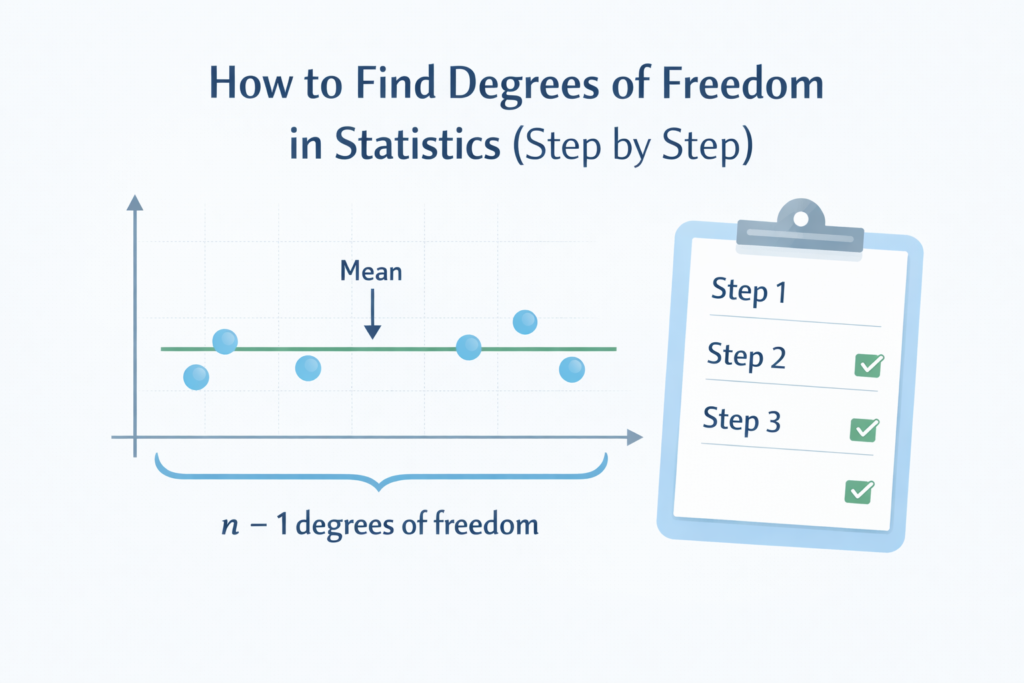
A common constraint is the sample mean. Once the mean is fixed, one value in the data set is no longer free to change.
Why DF Is Often n Minus 1
In many basic statistical tests, such as a one sample t test, there is one constraint.
That constraint is the estimated mean.
Because of this, the formula becomes:
This is why you often see df written as n minus 1 in statistics books.
Important Reminder
Not all tests use the same degrees of freedom formula.
Some tests include:
- Multiple constraints
- Group based calculations
- Table based relationships
This is why learning how to calculate degrees of freedom correctly for each test is so important.
How to Find Degrees of Freedom Manually

Finding degrees of freedom becomes much easier when you follow a structured process. Instead of memorizing formulas, focus on understanding what limits your data.
Step 1: Identify the Type of Statistical Test
Start by determining which test you are using. Different tests use different degrees of freedom formulas.
Common examples include:
- t test
- Chi square test
- ANOVA
This step prevents using the wrong df formula.
Step 2: Count the Total Number of Observations
Next, count how many values are in your data set.
This number is usually written as n.
For example, if your data set contains 15 values, then n equals 15.
Step 3: Identify Constraints in the Data
Constraints are rules that limit how values can change.
The most common constraint is calculating the mean from the data. Once the mean is fixed, one value is no longer free.
Some tests include:
- One constraint
- Multiple constraints
- Group based constraints
Step 4: Apply the Correct Formula
Now apply the appropriate degrees of freedom formula.
For many basic tests:
For other tests, the formula may involve:
- Number of rows and columns
- Number of groups
- Sample sizes per group
Step 5: Double Check Your Result
Before moving forward, confirm:
- You used the correct test
- You counted observations correctly
- You included all constraints
This final check helps avoid calculation errors.
Once you understand this process, it becomes much easier to learn how to determine degrees of freedom for any statistical test.
How to Find Degrees of Freedom for a t Test
A t test is one of the most common statistical tests, and each type uses a slightly different degrees of freedom calculation.
Start by checking which of the three t tests you are running.
Degrees of Freedom for a One Sample t Test
A one sample t test compares the mean of a sample to a known value.
Formula for One Sample t Test
Example
If your sample has 20 observations:
- n = 20
- Degrees of freedom = 20 − 1 = 19
This formula is used because the sample mean creates one constraint.
Degrees of Freedom for an Independent Two Sample t Test
This test compares the means of two independent groups.
Formula for Two Sample t Test
Example
If:
- Group 1 has 15 observations
- Group 2 has 18 observations
Then:
- Degrees of freedom = (15 + 18) − 2 = 31
The subtraction accounts for estimating two separate means.
Degrees of Freedom for a Paired t Test
A paired t test compares two related measurements, such as before and after data.
Formula for Paired t Test
Here, n represents the number of pairs, not individual values.
Why t Test DF Matters
Degrees of freedom affect:
- The shape of the t distribution
- Critical values
- P value calculations
Using the wrong df can change your test result.
Once you understand how to find degrees of freedom for t test, applying it becomes straightforward.
How to Find Degrees of Freedom for Chi Square Tests
Chi square tests are used to analyze relationships between categorical variables.
The degrees of freedom depend on the structure of the data, not the sample size alone.
Degrees of Freedom for Chi Square Test of Independence
This test checks whether two categorical variables are related.
Formula
Step by Step Example
Suppose you have a table with:
- 3 rows
- 4 columns
Calculation:
- Subtract 1 from the number of rows → 3 − 1 = 2
- Subtract 1 from the number of columns → 4 − 1 = 3
- Multiply the results → 2 × 3 = 6
Degrees of freedom = 6
Degrees of Freedom for Chi Square Goodness of Fit Test
This test checks whether observed data matches an expected distribution.
Formula
Example
If your data has 5 categories:
- Degrees of freedom = 5 − 1 = 4
If you estimated parameters from the data, subtract one more degree of freedom.
Why Chi Square DF Is Different
Chi square tests do not use means or variances.
Degrees of freedom come from how many categories are free to vary once totals are fixed.
Count the rows and columns of the table, not the number of responses.
Degrees of Freedom in ANOVA

In ANOVA, degrees of freedom help explain where variation comes from. ANOVA involves multiple degrees of freedom, each tied to a source of variation. You can calculate these variations using an ANOVA calculator.
Instead of one df value, ANOVA uses multiple degrees of freedom, each tied to a source of variation.
Why ANOVA uses multiple degrees of freedom
ANOVA splits total variation into parts:
- Variation between groups
- Variation within groups
- Total variation in the data
Each part gets its own degrees of freedom.
Types of degrees of freedom in ANOVA
ANOVA has three main df values.
1. Degrees of freedom between groups
This shows how many group means can vary freely.
Formula:
Where:
- k = number of groups
Example:
If you compare 4 groups:
- df_between = 4 − 1 = 3
2. Degrees of freedom within groups
This represents variation inside each group.
Formula:
Where:
- N = total observations
- k = number of groups
Example:
If you have 20 total values across 4 groups:
- df_within = 20 − 4 = 16
3. Total degrees of freedom
This represents total variability in the data.
Formula:
Example:
- df_total = 20 − 1 = 19
Why these degrees of freedom matter
Degrees of freedom exist because statistical calculations often include constraints. These constraints impact various tests, such as the chi-square tests where degrees of freedom are used to analyze the relationship between categorical variables.
ANOVA uses these df values to:
- Calculate mean squares
- Compute the F statistic
- Decide if group differences are statistically significant
Without correct degrees of freedom, ANOVA results are invalid.
Degrees of Freedom Explained with Simple Examples
Degrees of freedom sound complex.
But they are actually very practical.
At a basic level, degrees of freedom tell you how many values are free to change.
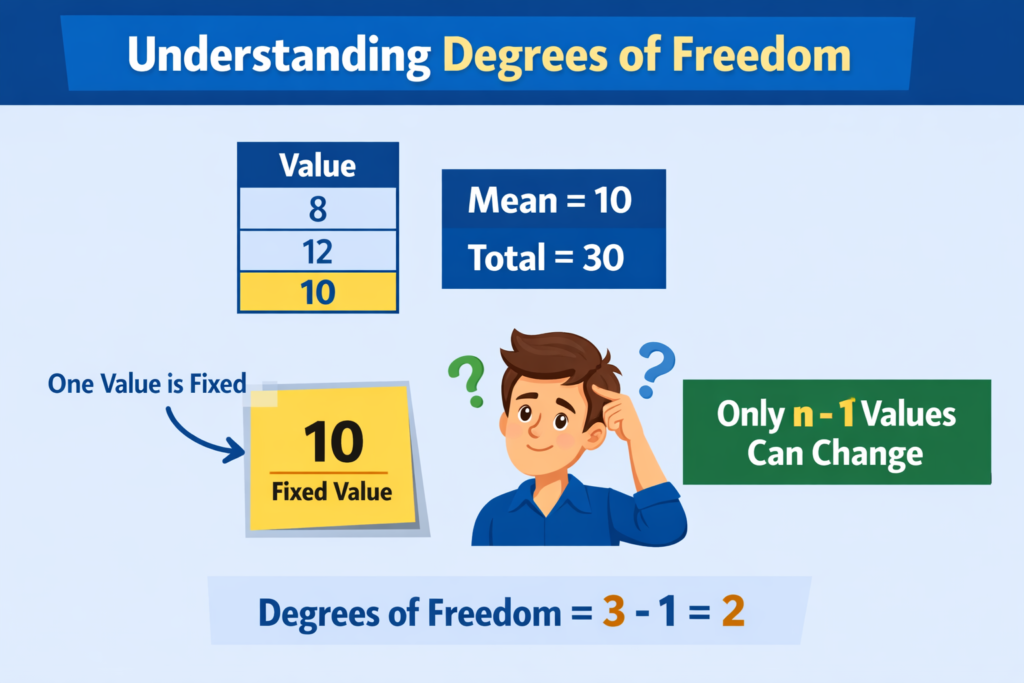
Example 1: Degrees of freedom with one value fixed
Imagine you have 3 numbers.
Their average must be 10.
That means the total must be:
If you choose:
- First number = 8
- Second number = 12
The third number is forced to be:
You only had freedom to choose 2 values.
So:
This explains why the formula n − 1 exists.
Example 2: Degrees of freedom in a sample
Suppose you collect 5 test scores.
Once the mean is calculated:
- 4 values can change
- 1 value becomes fixed
That is why, in statistics:
For 5 values:
This applies to:
- Sample variance
- Sample standard deviation
- One sample t test
Example 3: Degrees of freedom for two groups
Now imagine two groups:
- Group A has 6 values
- Group B has 6 values
Total observations: N = 12
For an independent t test:
df = n₁ + n₂ − 2
df = 6 + 6 − 2
df = 10
Why subtract 2?
Because each group uses one degree of freedom to calculate its mean.
Example 4: Degrees of freedom in a table
Degrees of freedom are not always about numbers.
Sometimes they depend on structure.
Take a chi square table with:
- 3 rows
- 4 columns
Once row and column totals are fixed:
df = (rows − 1) × (columns − 1)
df = 2 × 3
df = 6
Only 6 cells can vary freely.
Why these examples matter
Understanding degrees of freedom helps you:
- Choose the correct statistical test
- Read tables correctly
- Avoid calculation errors
Without this understanding, formulas feel random.
With it, they make sense.
Common Mistakes When Calculating Degrees of Freedom
Degrees of freedom look simple.
But many errors happen because small details are ignored.
Below are the most common mistakes people make when calculating degrees of freedom, and how to avoid them.
Mistake 1: Using the Wrong Formula
Not every statistical test uses the same df formula.
A common error is using:
for every situation.
That formula works for:
- One sample t test
- Paired t test
But it does not work for:
- Independent t tests
- Chi square tests
- ANOVA
Always confirm the test type before choosing a formula.
Mistake 2: Forgetting About Constraints
Degrees of freedom exist because of constraints.
Many people:
- Count observations
- Ignore estimated values like the mean
If you estimate:
- One mean → subtract 1 df
- Two means → subtract 2 df
Forgetting this leads to inflated degrees of freedom and incorrect results.
Mistake 3: Confusing Sample Size with Degrees of Freedom
Sample size and degrees of freedom are related, but they are not the same.
Example:
- Sample size = 10
- Degrees of freedom = 9
Using sample size directly instead of df can produce:
- Wrong critical values
- Incorrect p values
Mistake 4: Miscounting Rows or Columns in Chi Square Tests
For chi square tests, degrees of freedom depend on table dimensions, not total values.
The correct formula is:
Common errors include:
- Forgetting to subtract 1
- Counting totals as rows or columns
Mistake 5: Rounding Degrees of Freedom Incorrectly
When using statistical tables:
- Always round down, not up
Rounding up makes the test less conservative and increases error risk.
Mistake 6: Blindly Trusting Software Output
Statistical software calculates df automatically.
That does not mean you should ignore the logic.
Software mistakes happen when:
- Data is entered incorrectly
- The wrong test is selected
Always verify df manually, especially for reports and publications.
Why Avoiding These Mistakes Matters
Incorrect degrees of freedom can:
- Change significance results
- Mislead conclusions
- Reduce credibility
Understanding how to determine degrees of freedom correctly protects your analysis.
Using a Degrees of Freedom Calculator
A degrees of freedom calculator can save time.
But only if you understand what goes into it.
A calculator still needs you to pick the right test first.
When a Degrees of Freedom Calculator Is Useful
A calculator is useful when:
- You are working with large data sets
- Multiple groups are involved
- You need quick verification
It is especially helpful for:
- t tests
- Chi square tests
- ANOVA
How to Use a Degrees of Freedom Calculator Correctly
Follow these steps to avoid mistakes.
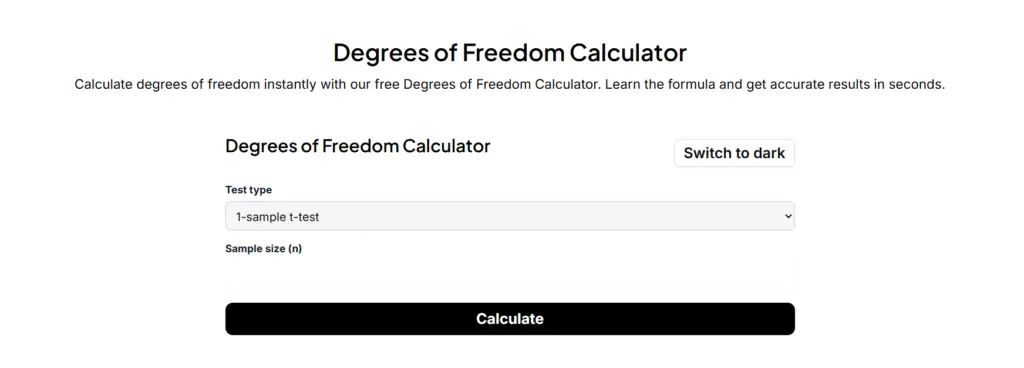
Step 1: Identify the statistical test
Before entering numbers, confirm:
- t test
- chi square test
- ANOVA
Each test requires different inputs.
Step 2: Enter the correct values
Depending on the test, you may need:
- Sample size
- Number of groups
- Rows and columns
Double check all inputs.
Step 3: Review the result
Do not accept the output blindly.
Ask yourself:
- Does the df value make sense?
- Does it match the formula I expect?
If not, recheck your inputs.
Why You Should Still Learn Manual Calculation
Relying only on a calculator can be risky.
Manual understanding helps you:
- Catch input errors
- Choose the correct test
- Interpret results correctly
A calculator works best when you already know how to find df manually.
Frequently Asked Questions (FAQs)
How to find degrees of freedom?
To find degrees of freedom, first identify the statistical test you are using.
Then apply the correct formula.
For one sample or paired t test:
df = n − 1
For an independent t test:
df = n₁ + n₂ − 2
For chi square tests:
df = (rows − 1) × (columns − 1)
Degrees of freedom depend on constraints, not just sample size.
How to find degrees of freedom for chi square?
Degrees of freedom for a chi square test are based on the table size.
Use this formula:
This formula applies to both goodness-of-fit and independence tests.
How to find degrees of freedom for t test?
Degrees of freedom for a t test depend on the type of test.
One sample t test:
df = n − 1
Paired t test:
df = n − 1
Independent two-sample t test:
df = n₁ + n₂ − 2
Always confirm the test type before calculating df.
How to calculate degrees of freedom?
To calculate degrees of freedom, count how many values are free to vary after constraints are applied.
Most formulas subtract estimated values like the mean.
That is why degrees of freedom are usually less than the sample size.
Using the correct formula ensures accurate statistical results.