

Chi Square Calculator
Chi square compares what you observed with what you would expect: χ² = Σ(O − E)² ÷ E. Pick your test, enter your counts, and the calculator shows the expected frequencies, the chi square statistic, degrees of freedom, and the p value with every step.
The Chi Square Calculator runs the test on your observed and expected values and shows the working. Whether you’re checking relationships between categorical variables or testing goodness of fit, this chi square test calculator gives you the chi square statistic, p value, and detailed step-by-step calculations.
Use it when you need the p value from a chi square statistic without working the formula by hand.
How to Use the Chi Square Calculator
Run the whole test in five steps: Just follow these steps:
Step 1: Choose Your Test Type
Select the chi-square test you want to run:
Chi-Square Goodness of Fit Test
Use when you want to compare:
- one set of observed values
vs. - one set of expected values
Example: expected equal distribution (25%, 25%, 25%, 25%).
Chi-Square Test of Independence (Contingency Table)
Use when comparing two categorical variables in a table format.
Example: Gender vs. Product Preference.
Step 2: Enter the Observed Values (O)
- For goodness of fit, enter values in a single row.
- For independence test, enter values into the contingency table (2×2, 3×3, 4×4, etc.).
Make sure all values are positive counts (no decimals).
Step 3: Enter the Expected Values (E)
(Only required for goodness of fit)
You may:
- Enter your own expected values
OR - Leave blank and our calculator computes equal expected frequencies automatically.
Step 4: Run the Calculation
Click Calculate Chi Square.
The tool returns:
Chi Square Statistic (χ²)
Measures how different the observed counts are from the expected counts.
Degrees of Freedom (df)
Automatically computed as:
- n – 1 for goodness of fit
- (rows – 1) × (columns – 1) for independence test
p Value
Shows whether results are statistically significant.
Step 5: Interpret Your Results
Your results page will show:
✔️ If p-value < 0.05
There is a significant difference or association.
The categories are not independent.
✔️ If p-value ≥ 0.05
There is no significant difference.
The categories may be independent.
If you’re unsure how to calculate chi square, this tool simplifies everything.
What Is a Chi Square Test?
A chi square test (χ² test) is a statistical method used to determine whether there is a significant relationship between categorical variables or whether the observed frequencies in a dataset differ from the expected frequencies.
It is used in:
- Research & experiments
- Market surveys
- Social sciences
- Medical studies
- A/B testing
- Genetics
- Data analytics
The chi square test helps answer questions like:
- Are two groups related?
- Is a treatment effective?
- Does a sample match an expected distribution?
The results tell you whether any difference is due to random chance or represents a statistically significant pattern.
Types of Chi Square Tests

The calculator covers three chi square tests:
1. Chi-Square Test of Independence
Used to check if two categorical variables are related.
Example: Is gender associated with product preference?
2. Chi-Square Goodness-of-Fit Test
Used to check whether the observed data fits an expected distribution.
Example: Do dice rolls follow a uniform distribution?
3. Chi-Square Test of Homogeneity
Used to compare distributions across multiple populations.
Example: Do different regions have similar buying patterns?
How the Chi Square Test Works
The test compares two things:
- Observed values (O) → The actual data you collected
- Expected values (E) → The values you would expect if there was no relationship
Then the formula calculates how far O differs from E.
If the difference is large → significant relationship
If the difference is small → no significant relationship
Chi Square Formula
The core formula for calculating chi square
If:
- χ² is large → Significant difference (reject null hypothesis)
- χ² is small → Data fits expected pattern (fail to reject null)
This formula is used in the chi square statistic calculator built into this tool.
How the Chi Square Formula Works
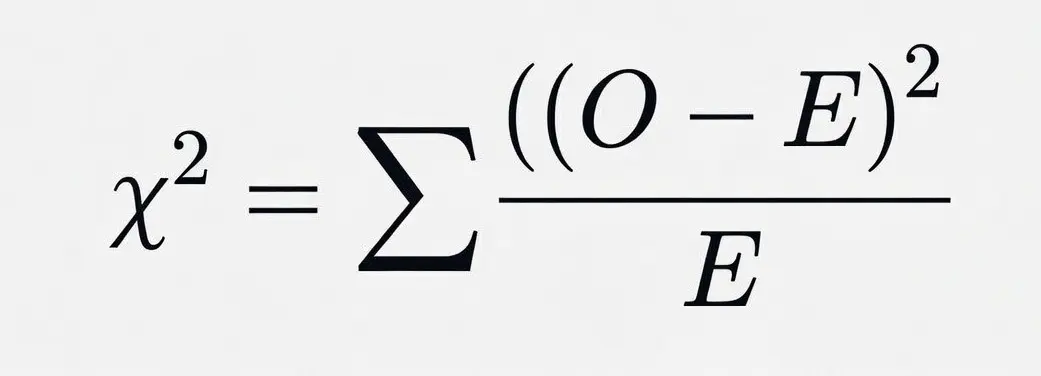
For each category:
- Subtract expected from observed → (O – E)
- Square the result → (O – E)²
- Divide by expected → (O – E)² / E
- Add everything together → Σ
This final value is your chi square statistic.
How to Calculate Expected Frequency in Chi Square
The expected frequency is what each cell would hold if the two variables had no relationship at all. Everything else in the test compares against it.
Expected frequency formula for a contingency table:
E = (Row total × Column total) ÷ Grand total
Say a table has a row total of 128, a column total of 96, and a grand total of 188. The expected count for that cell is (128 × 96) ÷ 188 = 65.36.
Expected frequency formula for goodness of fit:
E = Total ÷ Number of categories
With 60 students choosing between 4 topics, the expected count is 60 ÷ 4 = 15 per topic, assuming an equal split. If you have a different theory about the split, enter your own expected values instead.
One rule to watch: every expected count should be 5 or more. Below that, the chi square approximation breaks down and the p value stops being trustworthy. Combining small categories usually fixes it. The reason is that your p value is read off the chi square distribution rather than calculated from your raw counts, so once the approximation fails you get a number that looks perfectly normal and means nothing.
How to Calculate the Expected Value in Chi Square (Worked Example)
Numbers make this click faster than formulas. Suppose you survey 200 people about a product and split them by gender. Men who said yes total a row of 128, and the yes column totals 96, out of 188 responses overall. The expected count for men who said yes is:
E = (128 × 96) ÷ 188 = 65.36
You repeat that for every cell, always using its own row total times its own column total, divided by the grand total. Once you have all four expected counts, you compare each observed count against its expected count using the chi square formula. For a goodness of fit test the logic is simpler still: if you expect an even split, just divide the total by the number of categories. Sixty students across four topics gives 60 ÷ 4 = 15 expected per topic.
How Do You Find the P Value From Chi Square?
The p value tells you whether your chi square result means anything or whether it is just noise. You need two things to find it: your chi square statistic and your degrees of freedom. Feed both into a chi square distribution table or the calculator above, and you get the probability that a gap this large happened by pure chance.
Here is the plain reading. A small chi square value sits near the middle of the distribution, so its p value is high and your data matches expectation. A large chi square value sits far out in the tail, so its p value is low and something real is going on.
| P value | Compared to α = 0.05 | What it means |
|---|---|---|
| p < 0.01 | Well below | Strong evidence of a relationship. Reject the null hypothesis. |
| p < 0.05 | Below | Statistically significant. The variables are likely related. |
| p = 0.05 to 0.10 | Borderline | Weak or no evidence. Treat with caution. |
| p > 0.05 | Above | Not significant. No real difference from expected. |
Worked example. Say you run a chi square test and get χ² = 4.00 with 1 degree of freedom. Looking that up gives a p value of about 0.0455. Since 0.0455 is below 0.05, the result is significant and you reject the null hypothesis. Change nothing but the degrees of freedom to 3, and the same χ² = 4.00 gives a p value near 0.26, which is not significant. The degrees of freedom matter as much as the statistic itself.
To calculate the p value by hand you would need the chi square cumulative distribution, which involves the gamma function and is not practical on paper. A p value calculator or the tool on this page handles that math for you in one click.
How to Calculate Chi Square (Manually)
- Create a table for observed and expected frequencies
- Apply the chi square formula
- Find degrees of freedom:
- Goodness-of-fit: df = categories − 1
- Independence test: df = (rows − 1)(columns − 1)
- Use a chi square distribution table to calculate the p value
Or enter your counts in the calculator above.
Chi Square Test Example
Three worked examples follow: a goodness of fit test, a 2×2 test of independence, and a genetics cross.
Example : Chi Square Goodness of Fit Test
Scenario
A teacher believes students choose between four project topics equally.
She records choices from 60 students:
| Topic | Observed (O) |
|---|---|
| A | 18 |
| B | 12 |
| C | 20 |
| D | 10 |
Step 1: Expected Values (E)
If choices are equal:
So expected = 15 for each topic.
Step 2: Apply Chi Square Formula
Now calculate each category:
| Topic | O | E | (O−E)²/E |
|---|---|---|---|
| A | 18 | 15 | 0.6 |
| B | 12 | 15 | 0.6 |
| C | 20 | 15 | 1.67 |
| D | 10 | 15 | 1.67 |
Step 3: Chi Square Statistic
Step 4: Degrees of Freedom
Step 5: Interpretation
Using a chi square table or calculator:
- χ² = 4.54
- df = 3
- p-value ≈ 0.21
Conclusion
Since p > 0.05, there is no significant difference.
Students do not prefer topics differently, distribution is close to equal.
Example: Chi Square Test of Independence (2×2)
Scenario
A shop wants to know if gender is related to product choice. They record 100 customers:
| Product A | Product B | Row total | |
|---|---|---|---|
| Men | 20 | 30 | 50 |
| Women | 30 | 20 | 50 |
| Column total | 50 | 50 | 100 |
Step 1: Expected counts. Every cell has the same expected value here because both rows and both columns total 50: E = (50 × 50) ÷ 100 = 25 for each of the four cells.
Step 2: Apply the formula to each cell. Each cell contributes (O − E)² ÷ E. For every cell that is (difference of 5) squared over 25, which is 25 ÷ 25 = 1. Four cells each contribute 1.
Step 3: Chi square statistic. χ² = 1 + 1 + 1 + 1 = 4.00
Step 4: Degrees of freedom. df = (2 − 1) × (2 − 1) = 1 (Note what is not in that calculation: the 100 customers. For a contingency table df comes from the shape of the table, not the sample size, which is why a 2×2 table has one degree of freedom whether you survey 100 people or 10,000.)
Step 5: Interpretation. With χ² = 4.00 and df = 1, the p value is 0.0455. Since that is below 0.05, the result is significant. Gender and product choice are related in this sample.
Notice the contrast with the goodness of fit example above, where p was 0.21 and nothing was significant. Same test family, opposite conclusion, and the p value is what tells them apart.
Example: Chi Square in Genetics (9:3:3:1 Ratio)
Biology students hit this one constantly. A dihybrid cross predicts offspring in a 9:3:3:1 ratio. You observe 315, 101, 108, and 32 across the four groups, 556 total. Do the results fit the expected ratio?
Expected counts come from splitting 556 by the 9:3:3:1 proportions: 312.75, 104.25, 104.25, and 34.75.
| Group | Observed | Expected | (O − E)² ÷ E |
|---|---|---|---|
| 9 part | 315 | 312.75 | 0.016 |
| 3 part | 101 | 104.25 | 0.101 |
| 3 part | 108 | 104.25 | 0.135 |
| 1 part | 32 | 34.75 | 0.218 |
| Total (χ²) | 0.47 |
With χ² = 0.47 and df = 3 (four groups minus one), the p value is 0.93. That is far above 0.05, so the observed counts fit the 9:3:3:1 prediction beautifully. In genetics terms, the cross behaved exactly as Mendelian inheritance predicts.
Try these next
- Hypothesis Testing Calculator: run the full significance test around your chi square result.
- Critical Value Calculator: find the chi square cutoff for your α and degrees of freedom.
- Z Table: look up standard normal probabilities for other tests.
- Binomial Distribution Calculator: probabilities for two-outcome trials.
Frequently Asked Questions (FAQs)
How to calculate chi square?
To calculate chi square (χ²), subtract each observed value from the expected value, square the difference, divide by the expected value, and sum all results.
Formula:
χ² = Σ (O − E)² / E
Your chi square value shows how much the observed data differs from expected outcomes.
How to calculate p value from or for chi square?
Once you have the chi square statistic and the degrees of freedom (df), you can calculate the p value using a chi square distribution table or any online tool.
The p-value shows the probability that your observed differences could occur by chance.
How to calculate chi square in Excel?
You can calculate chi square in Excel using built-in functions:
1: CHISQ.TEST(observed_range, expected_range) → returns p-value
2: CHISQ.INV.RT(p, df) → returns chi square value
First prepare your observed and expected frequency tables, then apply the formula.
What is a Chi Square Test used for?
A Chi Square Test is used to check whether there is a significant relationship between categorical variables.
Is chi-square negative?
No, chi square values cannot be negative.
Because χ² is calculated from squared differences (O − E)², the result is always zero or positive. A value of zero means your observed and expected values match perfectly.